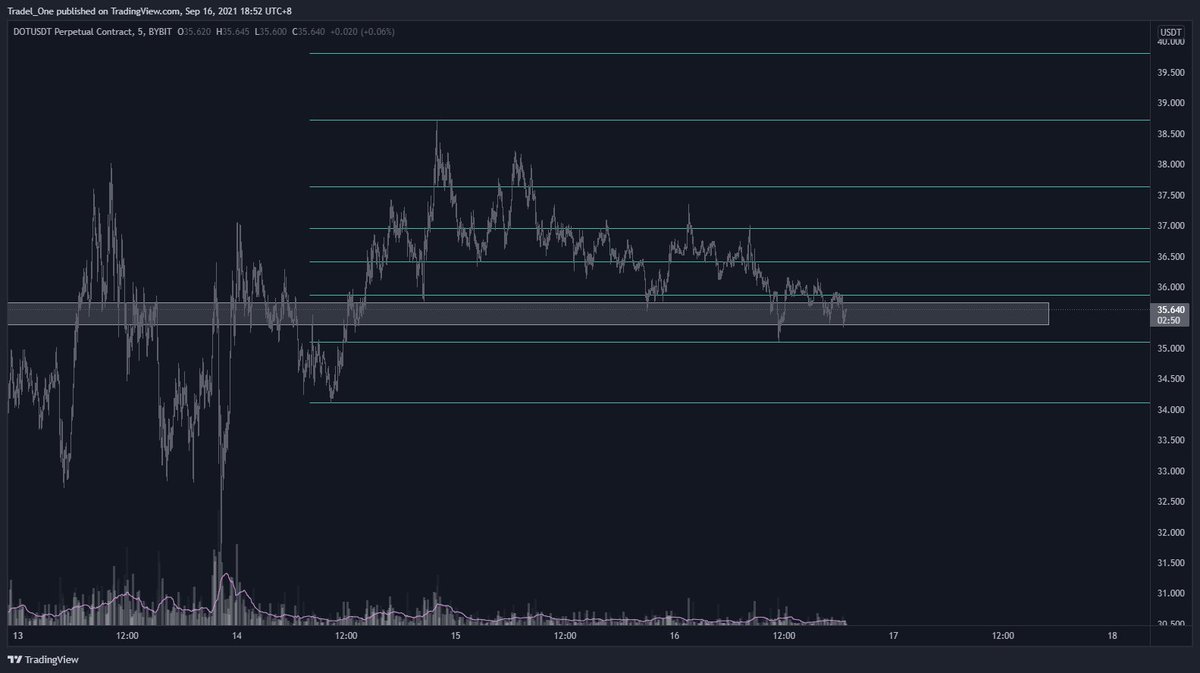
Hi guys, are you keen to take a quick look at $FTM chart, where we show how price is fractal in nature? Remember the BTC 5M scalps I've been sharing? (Check the similarities)
If so, read on:
The same is true for $BTC, $ETH, $FTT, $LUNA, $SOL, $SHIB, you name it
If so, read on:
The same is true for $BTC, $ETH, $FTT, $LUNA, $SOL, $SHIB, you name it

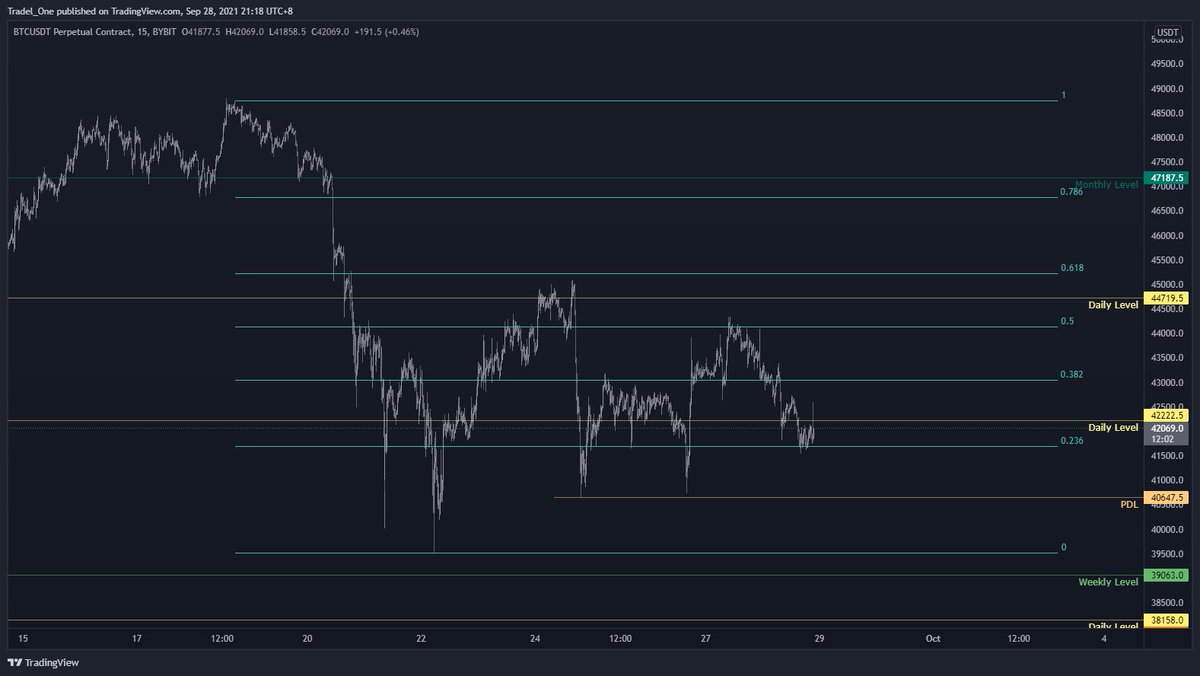
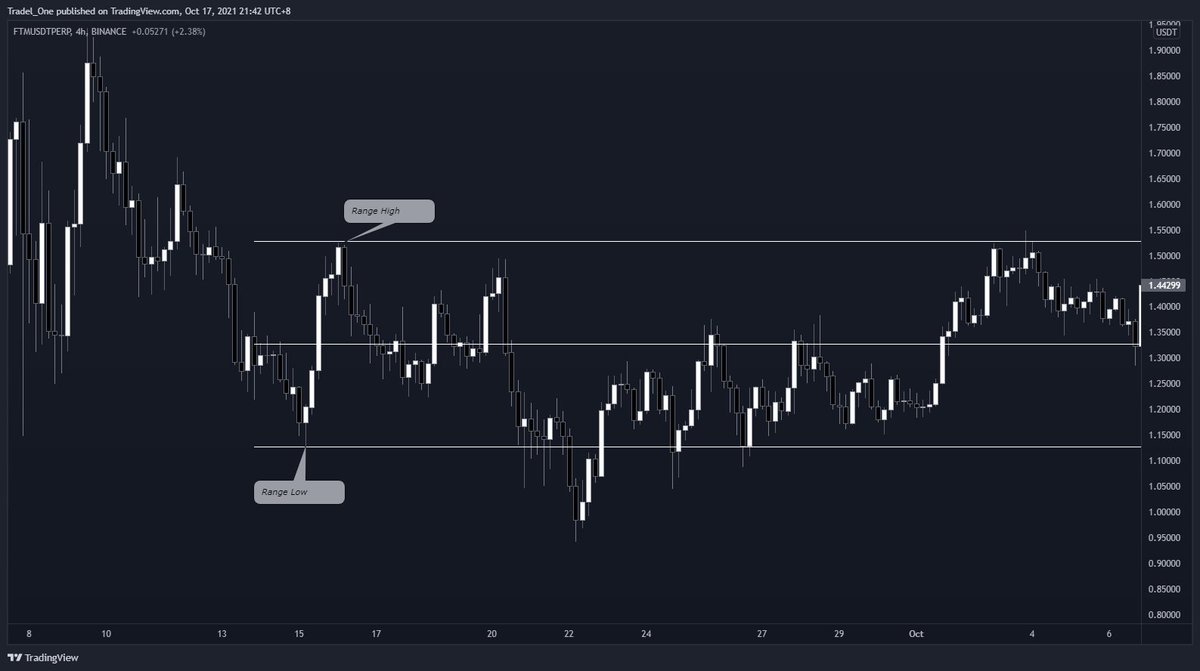
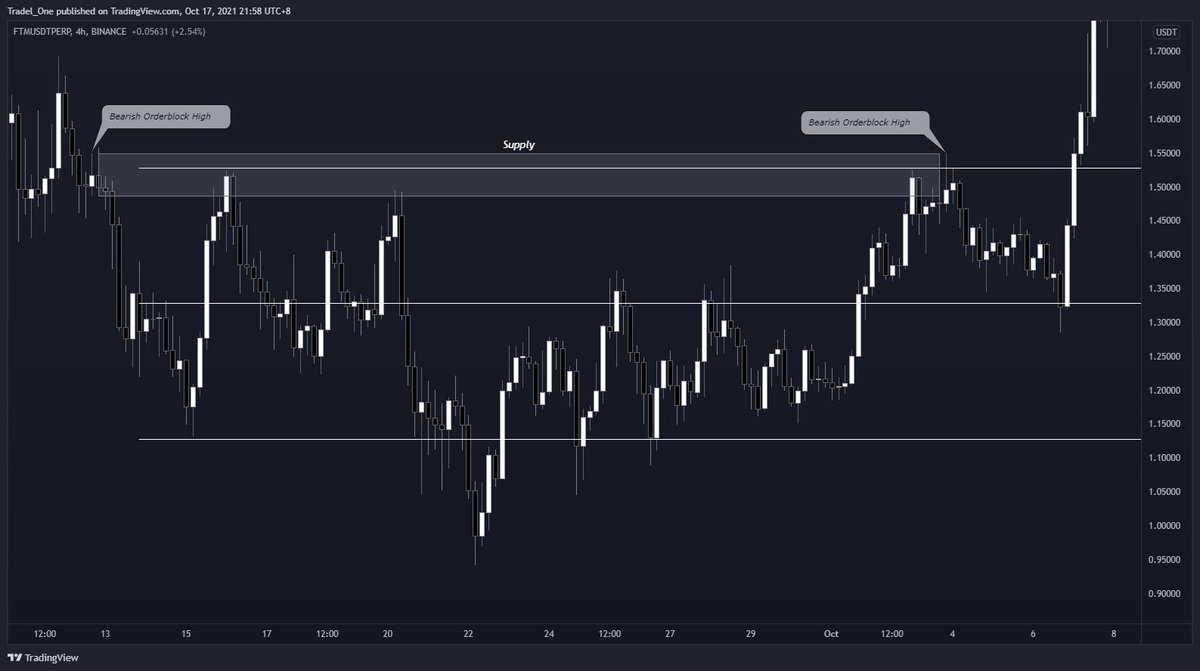
Looking on the 4H chart, let's observe a key item:
There is a Market Structure Break that causes a shift in market structure
We can also set an objective for price to head to based on the liquidity of an untested low
There is a Market Structure Break that causes a shift in market structure
We can also set an objective for price to head to based on the liquidity of an untested low

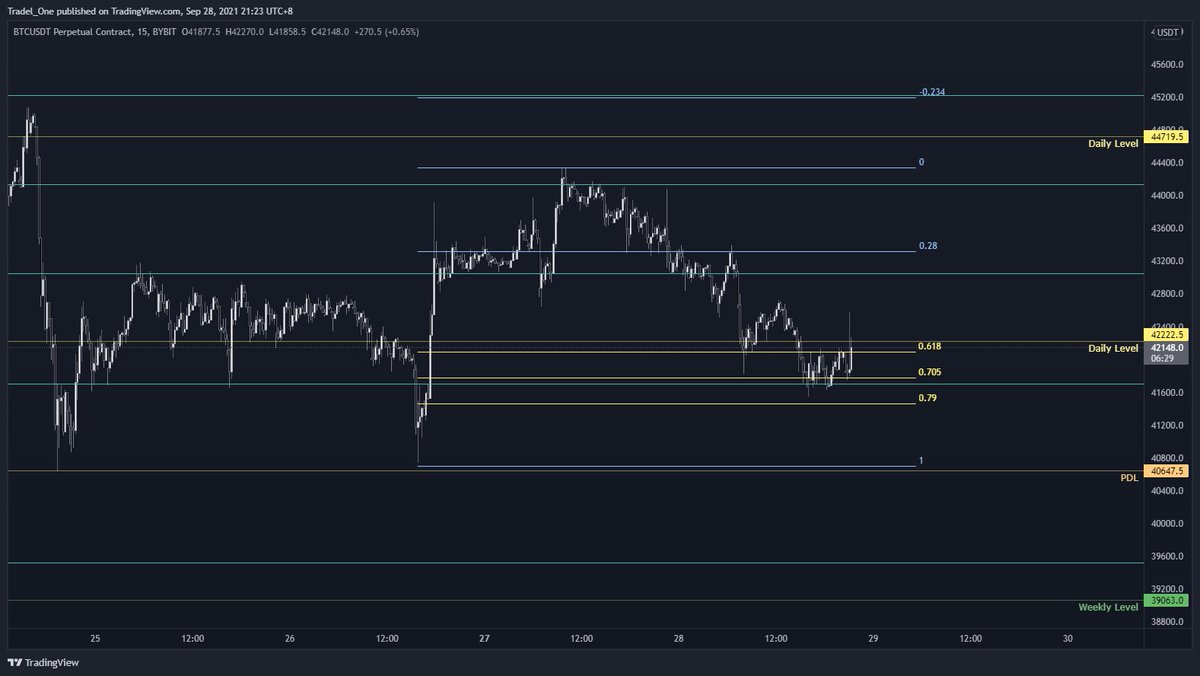
And what about understanding the next price move up?
See the detail on the chart:
- Retest of the bearish orderblock
- Sell off encountered
- Boom
- We've now got a range to play with
See the detail on the chart:
- Retest of the bearish orderblock
- Sell off encountered
- Boom
- We've now got a range to play with

The range is defined by the market structure we have logically set out
Price then restests the recent bullish orderblock at range low, runs up to the new bearish orderblock, retests mid range, has highs swept (liquidity), and then takes a run to range low.
See how this also aligns with our fib targets too
See how this also aligns with our fib targets too

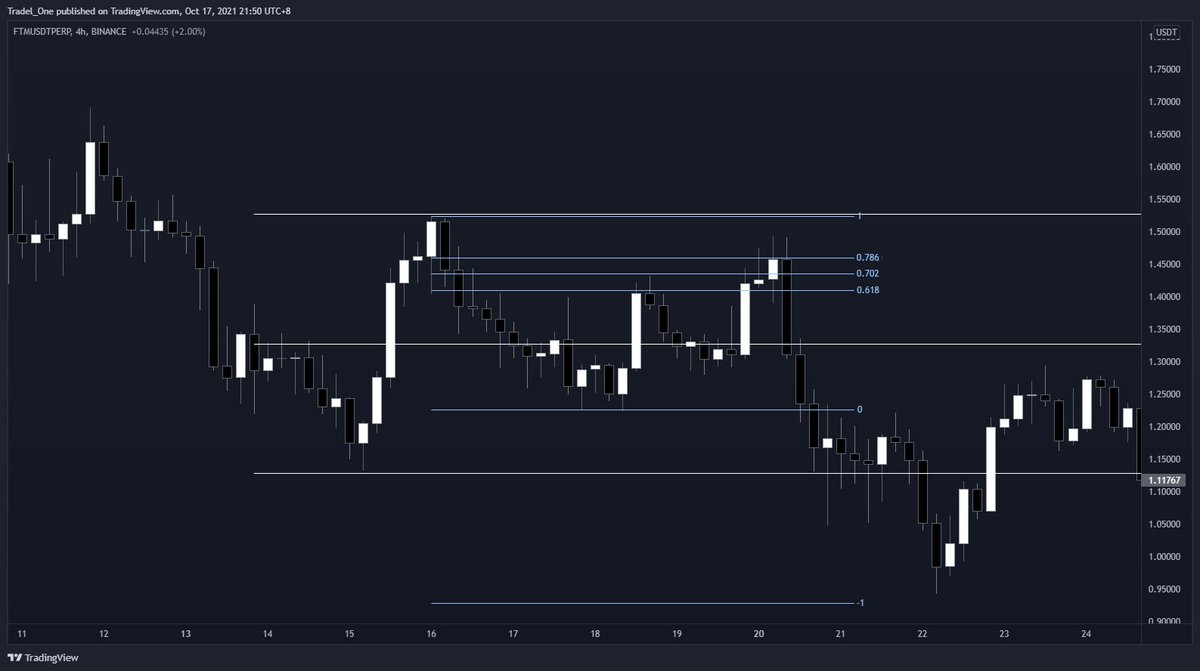
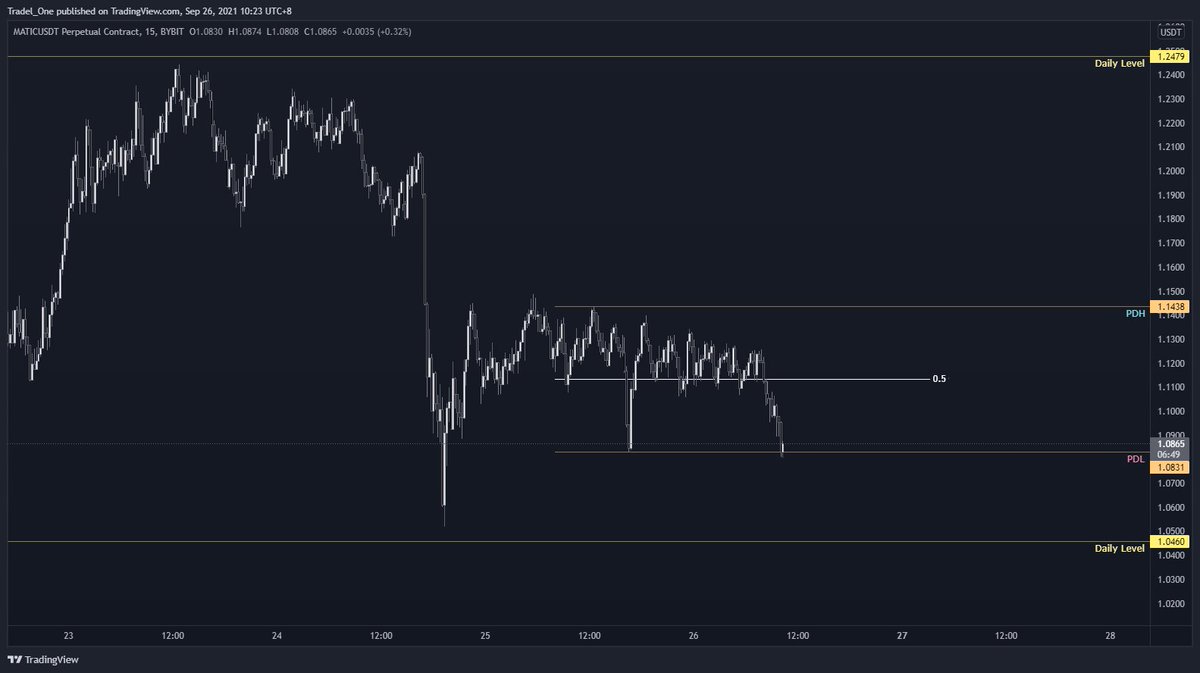
Remember: price is drawn to liquidity
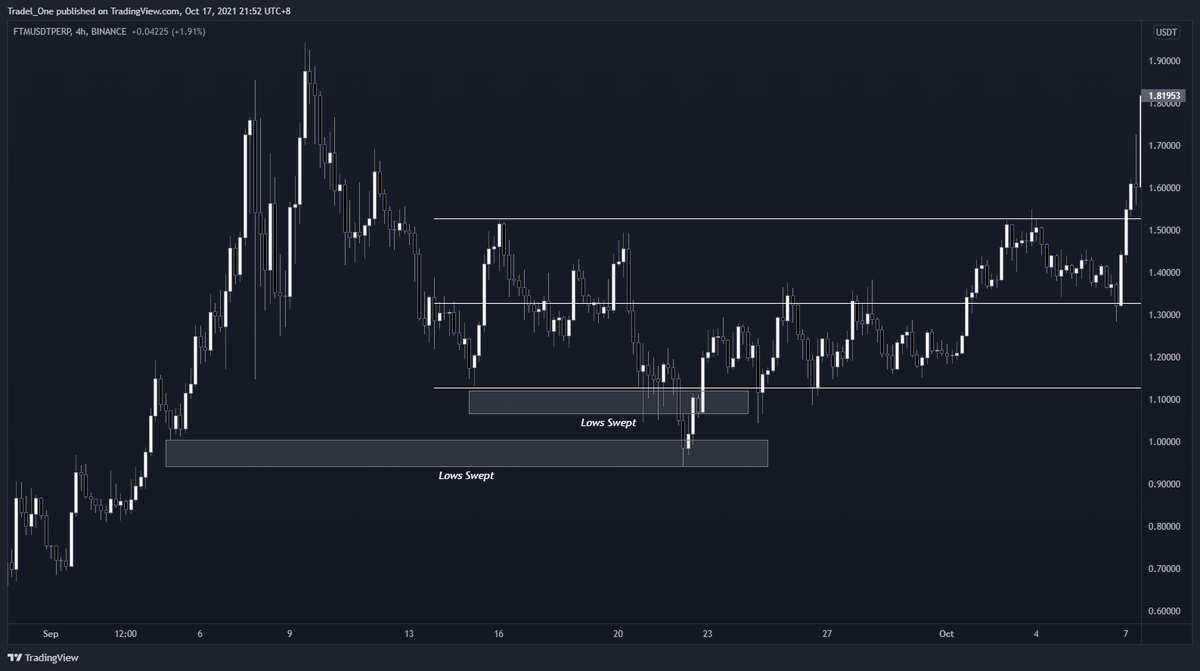
So what happens next?
Two series of swing lows are taken, and then price moves back upward to claim the bottom of the range, and then rallies off
See how the fibs come into play for trade entry upon range low retest?
So what happens next?
Two series of swing lows are taken, and then price moves back upward to claim the bottom of the range, and then rallies off
See how the fibs come into play for trade entry upon range low retest?
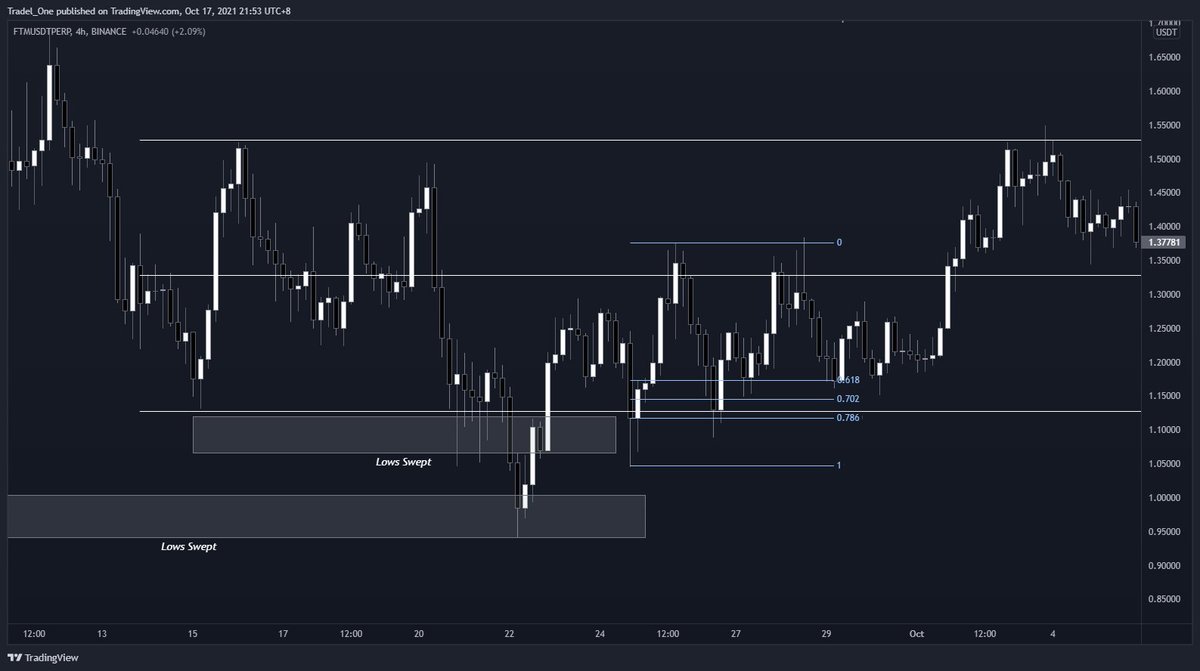
Your target then becomes the range high...but take a look at the previous price action we first looked at
The wick of the initial bearish orderblock that we encountered at range high, and the wick of the last candle before the sell of at range high retest are essentially the sam
The wick of the initial bearish orderblock that we encountered at range high, and the wick of the last candle before the sell of at range high retest are essentially the sam
You've noticed that not a single indicator was used in this price action tutorial, and we already know that we've seen price behave like this in the past.
What doe this mean? Well, simply: you can do this!
Just have to put the hours in and it's yours!
Hopefully this helps 🍻
What doe this mean? Well, simply: you can do this!
Just have to put the hours in and it's yours!
Hopefully this helps 🍻
• • •
Missing some Tweet in this thread? You can try to
force a refresh