1/11
The S&P 500’s outperformance over the Russell 2000 is reaching historic extremes, something that typically only happens in a bear market. Investors have redirected government stimulus money into the stock market.
A thread to explain
The S&P 500’s outperformance over the Russell 2000 is reaching historic extremes, something that typically only happens in a bear market. Investors have redirected government stimulus money into the stock market.
A thread to explain
2/11
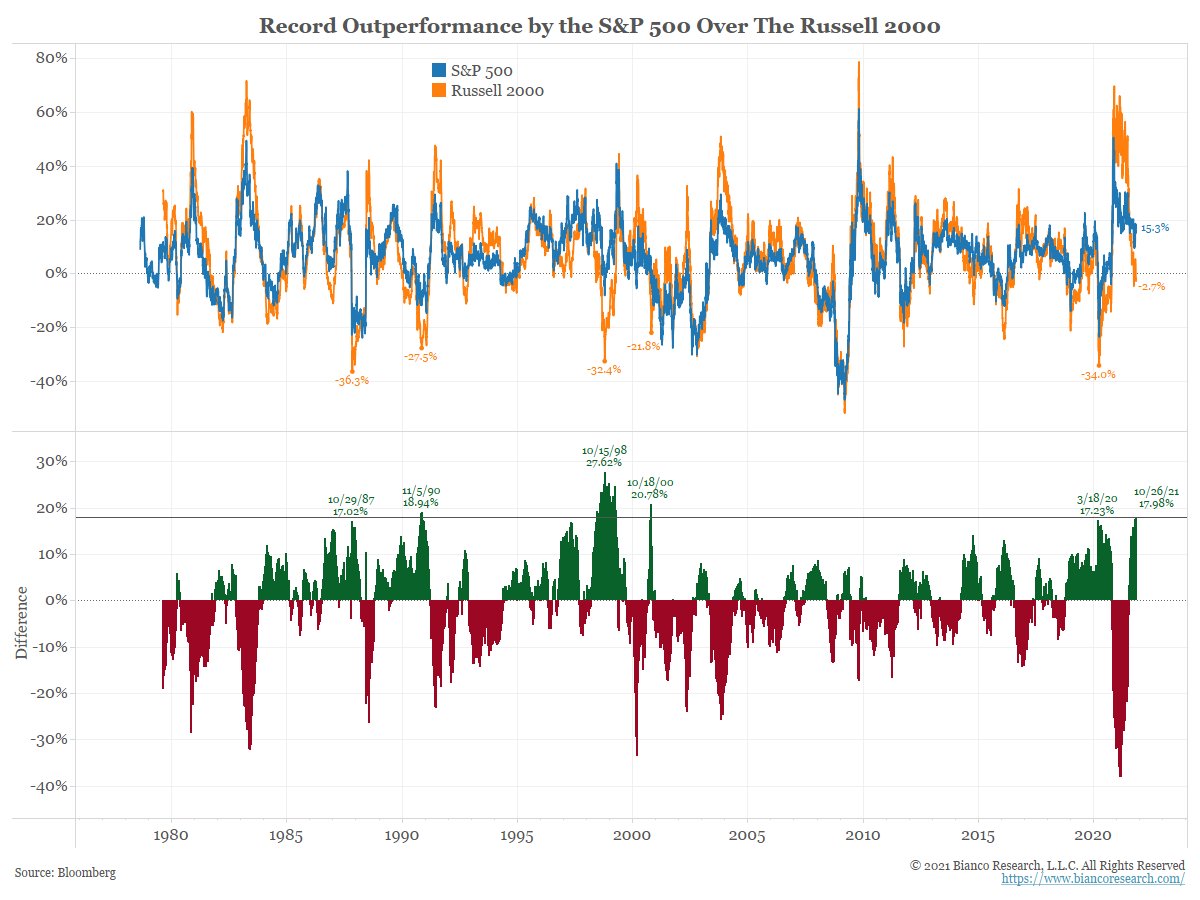
The next chart starts on March 15 and shows the rolling return of the S&P 500 (blue) and the Russell 2000 (orange). Since this date, the S&P 500 is up 15.26% while the Russell 2000 is down 2.72%.
The next chart starts on March 15 and shows the rolling return of the S&P 500 (blue) and the Russell 2000 (orange). Since this date, the S&P 500 is up 15.26% while the Russell 2000 is down 2.72%.

3/11
So, in the last 161 trading days, the S&P 500 has outperformed the Russell 2000 by 17.98%. This is the biggest outperformance by the S&P 500 over the Russell 2000 in 20 years!
So, in the last 161 trading days, the S&P 500 has outperformed the Russell 2000 by 17.98%. This is the biggest outperformance by the S&P 500 over the Russell 2000 in 20 years!
4/11
Also note that for all the times the S&P 500 outperformance was greater than the current, 17.98%, we highlight the Russell 2000’s return over this 161 days period. In all previous cases, it was in a bear market, falling at least 20%.
Also note that for all the times the S&P 500 outperformance was greater than the current, 17.98%, we highlight the Russell 2000’s return over this 161 days period. In all previous cases, it was in a bear market, falling at least 20%.
5/11
So why did we pick such a strange period? We picked the starting date of March 15, which was four days after the American Rescue Act passed (March 11) and the first of well over 100 million $1,400 stimulus checks started hitting bank accounts via direct deposit.
So why did we pick such a strange period? We picked the starting date of March 15, which was four days after the American Rescue Act passed (March 11) and the first of well over 100 million $1,400 stimulus checks started hitting bank accounts via direct deposit.
6/11
How significant was this money? The next chart shows total personal income, which totals over $21 trillion. As a result of these checks and previous stimulus efforts, government transfers hit 33% of total personal income, or about $7 trillion!
How significant was this money? The next chart shows total personal income, which totals over $21 trillion. As a result of these checks and previous stimulus efforts, government transfers hit 33% of total personal income, or about $7 trillion!

7/11
And this shot the savings rate to over 20% or levels that were thought not possible pre-pandemic. The current savings rate is still elevated compared to the pre-pandemic period at 9%.
And this shot the savings rate to over 20% or levels that were thought not possible pre-pandemic. The current savings rate is still elevated compared to the pre-pandemic period at 9%.

8/11
And what have Americans been doing with this money? They have been plowing it into the stock market. But in 2021 that largely means one thing, ETFs.
These combined flows hit weekly records in March/April as these checks were rolling in.
And what have Americans been doing with this money? They have been plowing it into the stock market. But in 2021 that largely means one thing, ETFs.
These combined flows hit weekly records in March/April as these checks were rolling in.

9/11
Show why are stocks going up? A tidal wave of money is being directed at indexed-based investment products, like ETFs. This is now even distorting the S&P 500 to Russell 2000 relationship. Normally such S&P 500 outperformance over the Russell happens in a bear market.
Show why are stocks going up? A tidal wave of money is being directed at indexed-based investment products, like ETFs. This is now even distorting the S&P 500 to Russell 2000 relationship. Normally such S&P 500 outperformance over the Russell happens in a bear market.
10/11
Now, they just buy S&P 500 ETFs and call it a day. As tens of billions of dollars are being directed at ETFs tied to the most popular index, the S&P 500, it forces relentless buying of these 500 stocks as the rest of the equity universe seems to languish.
Now, they just buy S&P 500 ETFs and call it a day. As tens of billions of dollars are being directed at ETFs tied to the most popular index, the S&P 500, it forces relentless buying of these 500 stocks as the rest of the equity universe seems to languish.
11/11
So what will cause the stock market to fall?
Current spending bills in Washington result in less "mailed money" to buy ETFs in the months to come?
Inflation push interest rates high enough to provide a reasonable alternative to stock ETF (read: S&P 500) investing?
So what will cause the stock market to fall?
Current spending bills in Washington result in less "mailed money" to buy ETFs in the months to come?
Inflation push interest rates high enough to provide a reasonable alternative to stock ETF (read: S&P 500) investing?
• • •
Missing some Tweet in this thread? You can try to
force a refresh