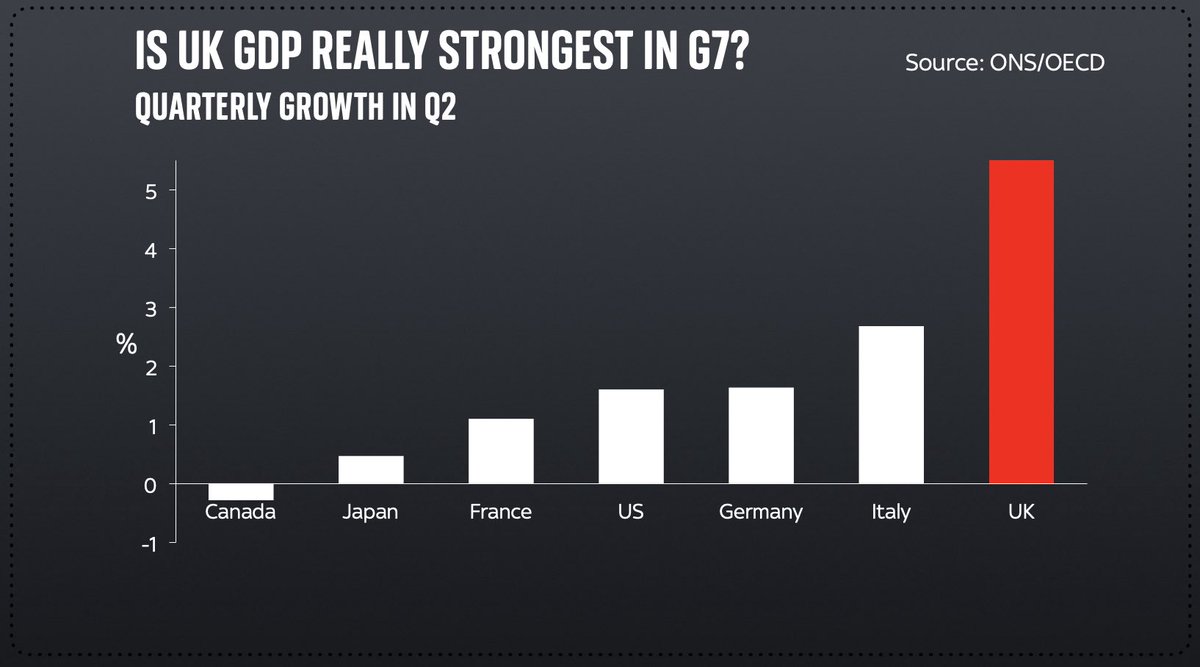
Half an hour left til Budget. Here are a few nuggets to ponder. Let’s start with a claim @RishiSunak may make (tho am hoping he doesn’t): that UK is fastest growing economy in G7.
It’s true if u look at Q2 alone (chart 1).
But look at GDP since covid and UK is mid/low table (ch2)
There’ll be lots of talk about fiscal responsibility and keeping the public finances in order.
All very well but by far the biggest issue in the coming decades is health-related costs which massively outweigh net zero. What does this govt do in the face of that?
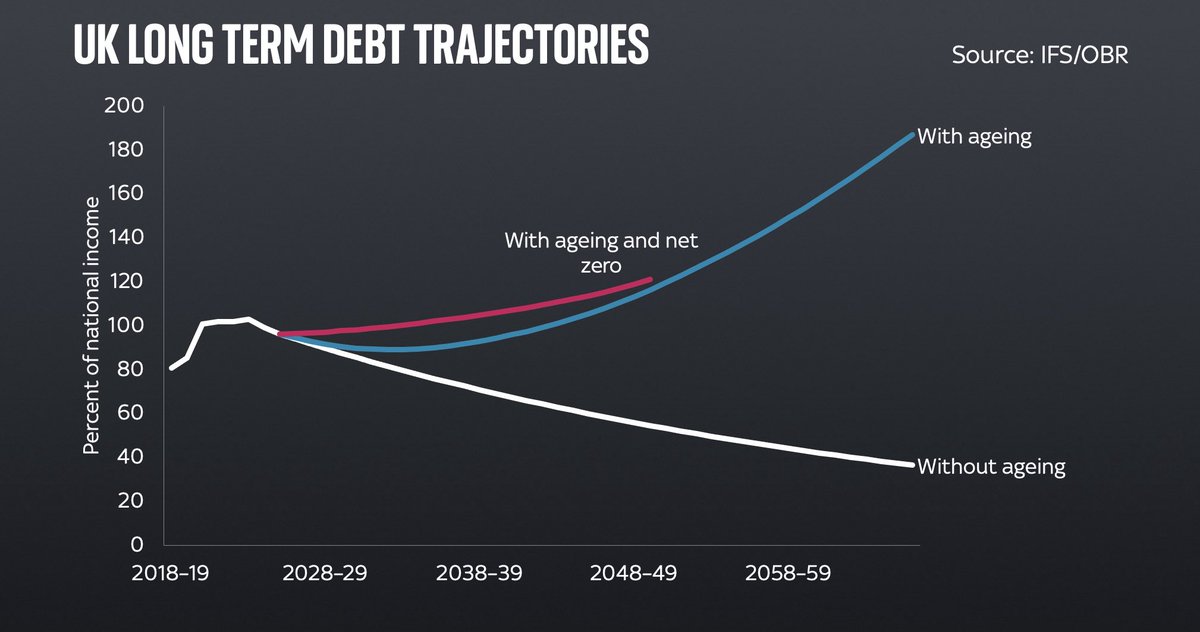
After all, this govt has already set aside a large slug of the extra spending review money to health. The real question is what happens to other depts. Do they get real terms Budget increases? Does the era of austerity live on in certain corners of Whitehall?
More broadly, the Spending Review is a big moment. It’s really the first Conservative Spending Review in the modern era: the last two were one-year mostly-ticking-over jobbies. All G Osborne’s were not about SAVING money not spending it. 3.2% real terms increases is not nothing!
We’ll get new fiscal rules from the Chancellor. Part of his justification will be that the govt remains vulnerable to rising debt costs. The mechanics of this are interesting if nerdy. Attached is a helpful primer from @TheIFS:
Here’s one way of looking at this: back in the day the main thing that pushed up debt interest was rising borrowing. These days it’s not so much rising borrowing as rising interest rates. Look: the bars on the right are now higher than the bars on the left.
Another interesting consequence of QE (partly explained in that IFS thing above) is that it means while the UK looks like it has very long debt maturities (which shield it from rising int rates), actually when you adjust for QE it’s 10yrs not 15yrs…
Worth saying: not everyone is convinced that this represents the sword of Damocles the Chancellor might suggest it does. @DuncanWeldon for one thinks the BoE could easily deal with this by adopting rules the ECB already has. We’ll see. duncanweldon.substack.com/p/britains-mac…
But the MAIN chart overshadowing this Budget is prob this one. Gas prices.
Households are facing a monumental squeeze this winter due to higher bills. That many are simultaneously facing the withdrawal of UC support intensifies it. Much of today will ultimately come back to this
• • •
Missing some Tweet in this thread? You can try to
force a refresh
Five things you need to know about today's Budget/SR. Do read my full analysis if/when you have time. It's in this link. But if you're pressed here's the quick 1,2,3,4,5: news.sky.com/story/sunaks-b…
1. The forecast contained some BIG changes: much higher growth. Look how much higher the dark blue line here is than the yellow line (last forecast). Also much higher inflation forecasts. This has a bearing on the fiscal numbers, so...
2. The Chancellor got a MASSIVE windfall thanks to these forecast changes. Higher growth/inflation both push up net tax receipts. Roughy £35bn a year each year, thanks to higher tax receipts (even after the extra cost of benefits/debt interest). That is a LOT of money.
🧵Few things to look out for in tomo’s Budget/Spending Review.
First, economic growth forecasts
They will almost certainly be raised - but by how much?
As you can see we are already running above the levels forecast in Mar. But when if ever do we get back to trend (dotted line)?
Given it’s a Budget we’ll doubtless have more taxes. But actually most of the action on this front has already happened. The Corp tax and NICs increases represent the biggest combined tax increase since the early 1990s. Seems unlikely anything tomo will change this big picture
It’s already been leaked that @RishiSunak will freeze fuel duty.
One can understand the rationale given soaring petrol costs.
But it’s a v hard one to square with govt’s green pledges. This is the UK’s biggest green tax!
OK that’s enough cross-country comparisons. How is the situation in the UK re cases, admissions and deaths? These charts tell some of that story. In short, the vaccines seem to be doing their job. Back in the late 2020 wave, look how correlated those lines were. Not any more.
I say the “vaccines are working”. But hang on: in that case why are even more vaccinated people dying of COVID now than unvaccinated people?
The answer comes back to CONTEXT, which is all-important here. Consider the latest data from English hospitals… assets.publishing.service.gov.uk/government/upl…
In the most recent period (13 Sept - 10 Oct) there were 2,805 Covid deaths in this database.
2,136 of them were fully-vaccinated.
Only 557 of were unvaccinated people (NB by unvaccinated I mean no doses at all).
Easy to assume from that the vaccines aren’t working. But hold on
I really REALLY didn’t want to have to do another Covid thread. Really. But given the numbers are on the rise - along with the inevitable hot takes (we’re heading for disaster! The vaccines aren’t working!), I’m dipping my toe back in the waters. Hopefully not for long. 🧵
Let’s start with this chart. You’ve prob seen it elsewhere. This Scary Chart shows that the UK’s COVID situation looks UNIQUELY terrible. Just look at that red line compared with other countries!
But that chart 👆misses out the most important bit of context: for better or worse the UK is doing far more Covid testing than almost any other country (first chart here). Put those two datapoints together to see positive tests as a % of total and UK situation looks less dramatic
If net zero is going to happen we need to re-do the industrial revolution all over again.
It’s hard to express how big a deal this is.
But I’ve had a go here: edmundconway.com/the-industrial…
The point is the Industrial Revolution wasn’t just about steel or textile manufacture.
It was a chemicals revolution
A concrete revolution
A glassmaking revolution
An aluminium revolution
A metals refining revolution
Plastics, silicon, fertilisers, batteries… I could go on…
And, guess what, ALL of those processes emit carbon. Sometimes via energy (OK so we can power them via renewables)
But also invariably carbon is emitted as part of the chemical/industrial process itself.
This chart from today’s HMT review of net zero underlines it.
CO2 EVERYWHERE
Here’s a thread abt a few of the most important things you need to know about getting to net zero and eliminating carbon emissions, but before we get stuck in let’s begin with a question.
How much do you suppose governments around the world are spending on research into energy?
If you’re anything like me you’re probably assuming they’re spending more than ever before. After all, they say they’re serious about averting climate change. They’ve pledged to eliminate emissions by 2050, right? And to do that we’re going to need serious tech breakthroughs…
This is an @IEA chart that underlines that need for tech breakthroughs. These bars show you how the world eliminates CO2 emissions by 2050. The key thing to focus on is the yellow bit.
Nearly HALF of all the emissions reductions are due to “technologies under development”