Kids and adults alike believe the world is going down in flames

Like Rep. Katie Porter's (D., Calif.) nine-year-old daughter says: “The earth is on fire and we’re all going to die soon”

Nope

World is actually burning ever less

References here: facebook.com/bjornlomborg/p…
Not because forests are decreasing — forest area increasing since 1982
essd.copernicus.org/articles/12/12…

"We show that—contrary to the prevailing view that forest area has declined globally—tree cover has increased by 2.24 million km2" nature.com/articles/s4158…
Yet, the claims of increasing fire are almost everywhere, here Boston Globe falsely claiming the new UN report says "the world is on fire"

And here Scientific American deciding to be political instead of reporting on science, using claims of increasing fire as their first point

You can read my new fire oped for WSJ here where I use this data and more (also for US and Australia)

wsj.com/articles/clima…
archive.ph/8w72w

• • •

Missing some Tweet in this thread? You can try to force a refresh
 

Keep Current with Bjorn Lomborg

Bjorn Lomborg Profile picture

Stay in touch and get notified when new unrolls are available from this author!

Read all threads

This Thread may be Removed Anytime!

PDF

Twitter may remove this content at anytime! Save it as PDF for later use!

Try unrolling a thread yourself!

how to unroll video
  1. Follow @ThreadReaderApp to mention us!

  2. From a Twitter thread mention us with a keyword "unroll"
@threadreaderapp unroll

Practice here first or read more on our help page!

More from @BjornLomborg

19 Oct
Even if entire EU went net-zero today and stayed net-zero for the rest of the century

impact rather small, reducing temperature rise in 2100 by 0.14°C (0.25°F)

Because vast part of 21st-century emissions come from currently poor world

UN climate model live.magicc.org
We don't have good estimates of what the EU net-zero policy will cost,

but similar estimates for the US shows 11.9% and for New Zealand 16% of GDP (environment.govt.nz/assets/Publica…)

It would imply costs of €6.300-8.500 per person per year (lower than US, because EU less rich)
So we have well-meaning EU leaders jetting off to Glasgow to commit to even stronger climate policies

that will drive up energy costs even more

cost EU citizens 10+% of their incomes

while having an immeasurable impact on climate by century's end

Read 7 tweets
17 Oct
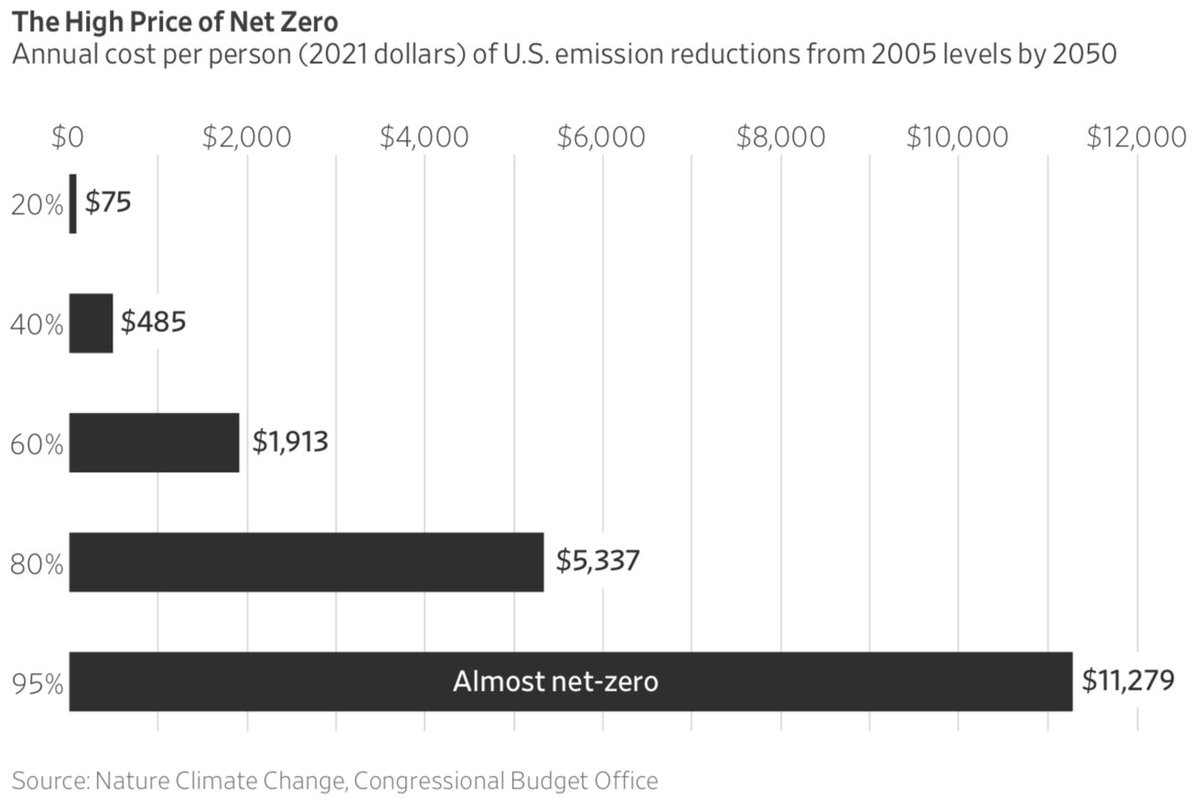
US going net-zero will cost more than $11,300 per person per year in 2050 according to new Nature study

That is almost 500x as much as average American willing to pay

That won't end well

my comment in WSJ
wsj.com/articles/clima…
archive.ph/4K48e
nature.com/articles/s4155…
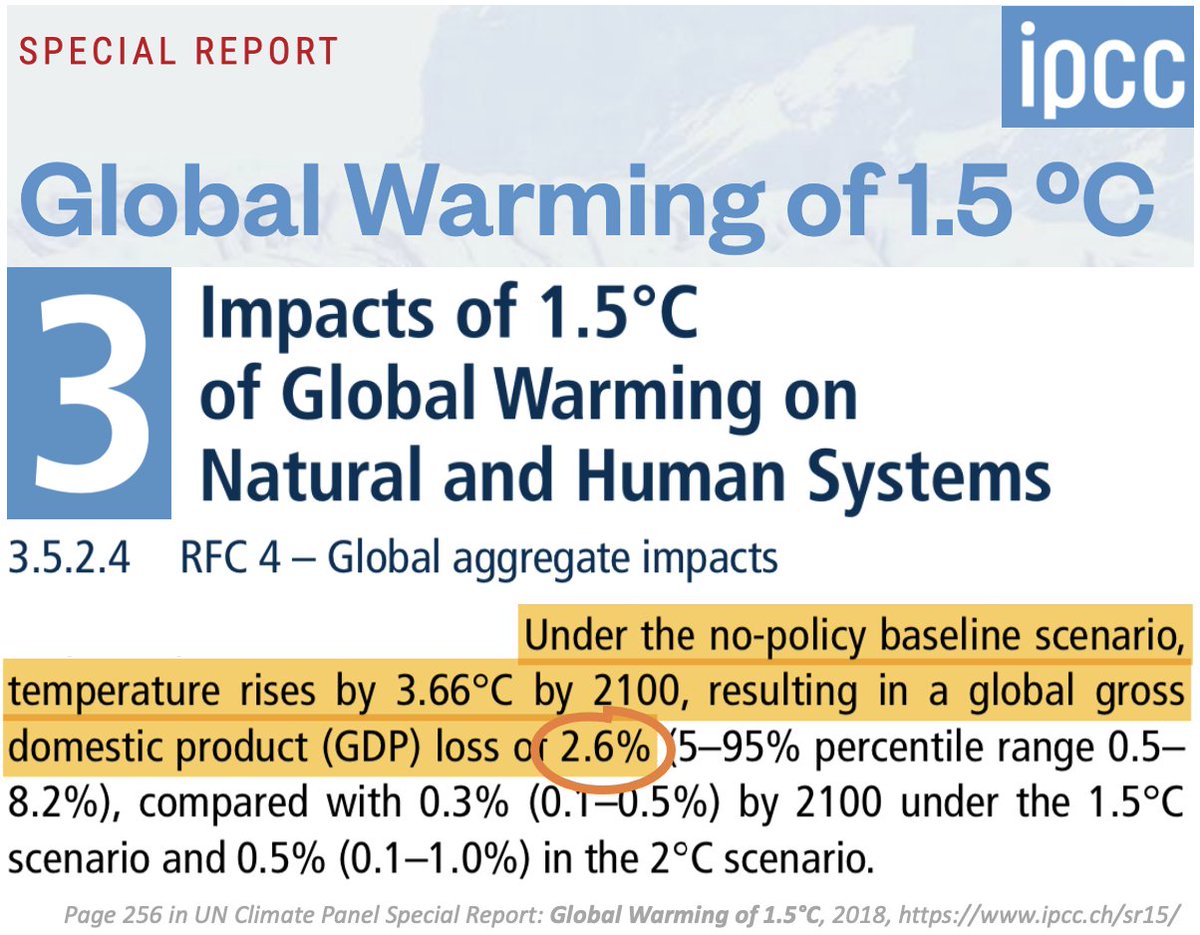
Compare the cost of US net-zero at 12+% GDP with the UN Climate Panel estimate of cost if we do *nothing* against climate change:

2.6% of GDP by 2100

We are currently doing too little, but doing too much is also dumb

ipcc.ch/sr15/
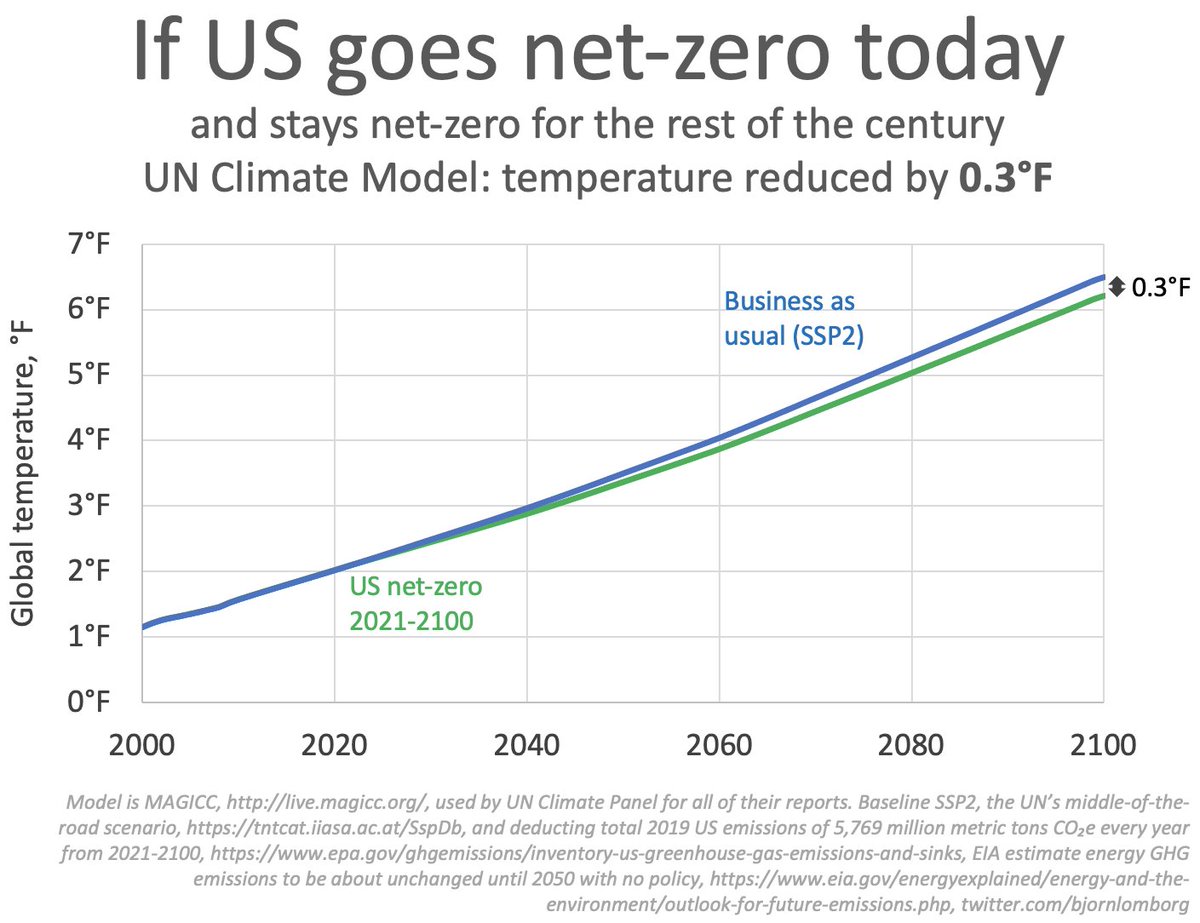
Even if entire US went net-zero today and stayed net-zero for the rest of the century

impact rather small, reducing temperature rise in 2100 by 0.3°F (0.16°C)

Because vast part of 21st century emissions come currently poor world

Using UN climate model live.magicc.org
Read 7 tweets
13 Oct
Electric cars net-bad everywhere

Switching from gasoline to electric means less CO₂

but electric cars 500kg+ heavier and therefore deadlier in accidents

Using realistic carbon cost at $68/ton (EU)

more deadly outweigh less CO₂

New Nature study:
nature.com/articles/d4158… Image
Electric cars are in general much heavier than their gasoline counterparts, which makes them much more dangerous in traffic

nature.com/articles/d4158… Image
Not surprisingly, this is not the preferred message,

so Nature article uses unrealistic $150 CO₂ price

Switching to heavier electric car on very clean electricity grids like Norway/France juust ok

Even at $150, switching bad in US, Germany, Japan, China, India & Australia Image
Read 6 tweets
12 Oct
Untrue Washington Post front-page story today

Claims “disasters worsen”
Study shows 𝗻𝗼 𝘀𝘂𝗰𝗵 𝘁𝗵𝗶𝗻𝗴

One example: heart disease up with temperature
Reality 𝗼𝗽𝗽𝗼𝘀𝗶𝘁𝗲

How is this following science?

🧵

washingtonpost.com/climate-enviro…
archive.md/m4z4d
@SallyBuzbee
Washington Post story over and again claims study shows how climate made things worse:

“weather events made worse by climate change”, “harsher events” “disasters worsen”

Actual Nature study only shows impacts – not whether positive or negative

nature.com/articles/s4155…
Actual Nature study doesn't show climate making stuff worse

It simply uses machine learning to analyze 600K article abstracts to identify climate impacts and code *where* and *what*

Conclude 85% pop lives where temp and/or precip changed detectable and attributable to man
Read 12 tweets
3 Oct
New study: climate makes children born today experience 2-36x more climate catastrophes

Lot of media coverage

But study assumes everyone stays poor and do nothing to adapt

Not remotely true of real world

So, what's the point, except to scare?

🧵

science.org/doi/10.1126/sc…
To predict 2100, scary climate study assumes nobody does anything after 2005

– how does that inform real-life decisions?

They don’t even tell you this in main study – you have to read the supplementary material, almost as if they don't want you to know

science.org/doi/10.1126/sc…
Predicting the world in 2021 with 1926 data is awful

Since 1926, sea levels risen 15-20cm so prediction: drowned significant parts of the world

But human ingenuity actually means that *more* land has been reclaimed than lost!

nature.com/articles/nclim…
Read 17 tweets
11 Sep
Global inequality is lower today than last 140 years

Ineq increase hugely in 1800s bc industrialized world pulls away

Ineq decline as poor world (China, India) starts gaining

Gini: 0=no ineq, 1= total ineq

New, amazing data from @PikettyLeMonde & co
wid.world/document/longr… Image
Income development 1820-2020:

In China, per person income dropped from 82% of world average in 1820 down to 20% in 1980, before rising to 109% in 2020

In Indonesia, it dropped from 57% in 1820 to 16% in 1950, up to 68% in 2020

wid.world/document/longr… Image
What drives global inequality?

Blue line shows domestic inequality: high, but lower in 1950s-80s

Orange line shows inequality between nations: increase dramatically after rich world industrialization, decline after 1980 as poor world is gaining again

wid.world/document/longr… Image
Read 7 tweets

Did Thread Reader help you today?

Support us! We are indie developers!


This site is made by just two indie developers on a laptop doing marketing, support and development! Read more about the story.

Become a Premium Member ($3/month or $30/year) and get exclusive features!

Become Premium

Too expensive? Make a small donation by buying us coffee ($5) or help with server cost ($10)

Donate via Paypal Become our Patreon

Thank you for your support!

Follow Us on Twitter!

:(