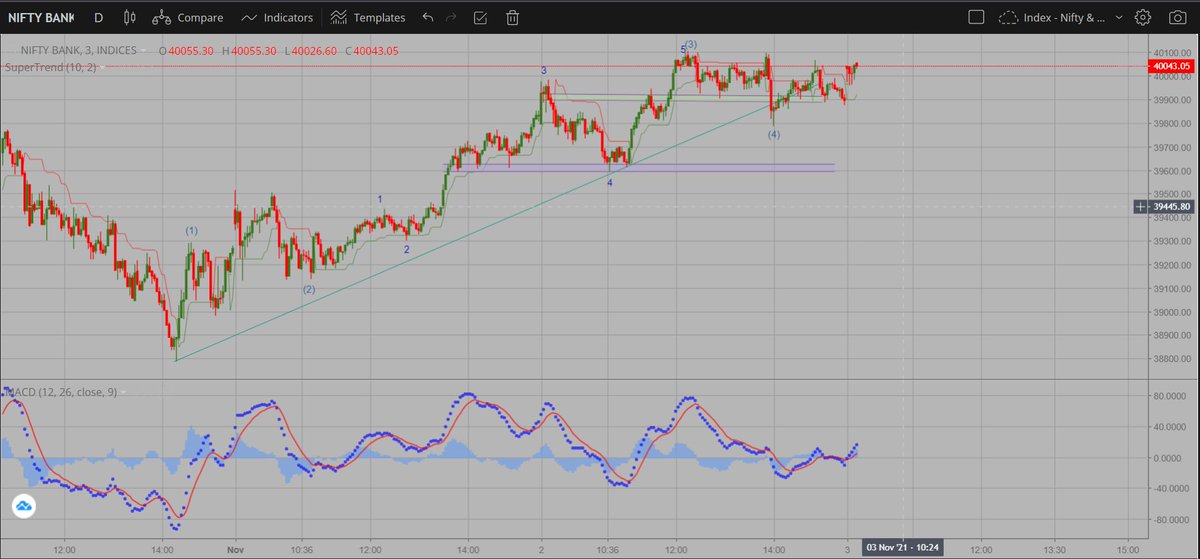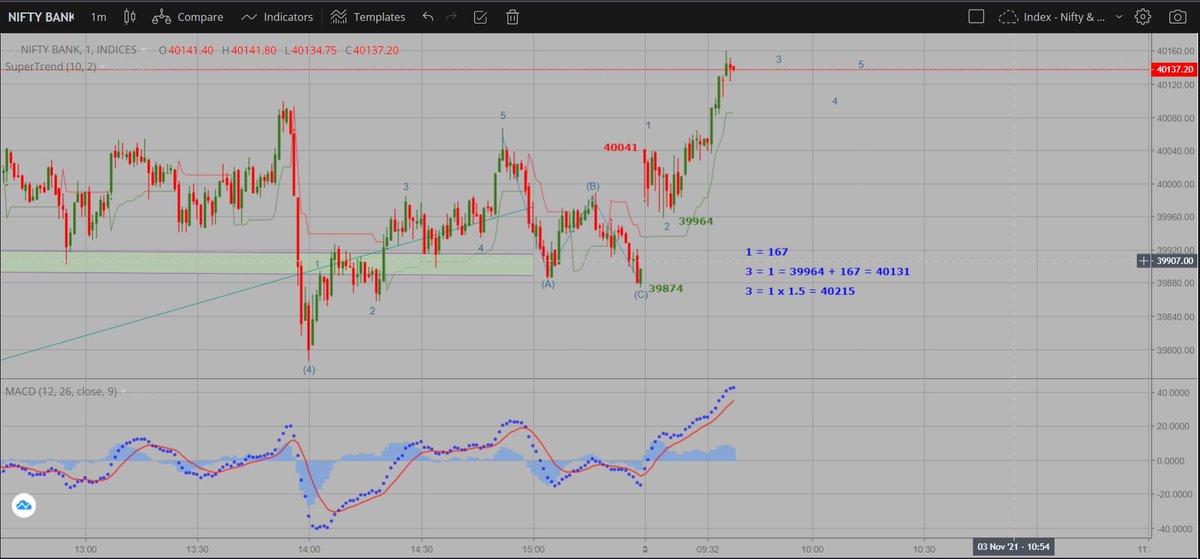
A simple beginning in this long journey.🙏
Let us choose the most simplest & most effective of all tools - #Elliottwave
IF the name sounds complex & alien to you, let us call it just #Wave - Why ?
In the market, Prices never flow like a river but unfold like waves.. yes., waves
Let us choose the most simplest & most effective of all tools - #Elliottwave
IF the name sounds complex & alien to you, let us call it just #Wave - Why ?
In the market, Prices never flow like a river but unfold like waves.. yes., waves

#Waves advance, then retrace and with each advance & retraces, they gather strength & thus the subsequent advances grow in strength & intensity until they blow themselves up. Then, they go into a quiet mode.
This is Nature's Law; Crowd behaviour and we deal with just that.
This is Nature's Law; Crowd behaviour and we deal with just that.

What this Nature's Law states is that the advances & declines follow "Fibonacci sequences"
1, (1+1)2, (2+1)3, (3+2)5, (5+3)8, (8+5)13, (13+8)21 & so on...
It has been observed by Ralph.N.Elliott (1939) that these advances move in 5 waves followed by a 3 wave decline - 12345 & abc
1, (1+1)2, (2+1)3, (3+2)5, (5+3)8, (8+5)13, (13+8)21 & so on...
It has been observed by Ralph.N.Elliott (1939) that these advances move in 5 waves followed by a 3 wave decline - 12345 & abc

What is a wave ? No explanation is given by Elliott himself Why? Co's it's highly subjective at the time of labeling each advance & decline. Each perceives it differently
Then, how do we approach it ?
Demand & supply restrict themselves to a channel till one overpowers the other
Then, how do we approach it ?
Demand & supply restrict themselves to a channel till one overpowers the other

This, channeling helps to identify each part of wave as 1st, now, 2nd followed by 3rd, etc.,
1st is an advance
2nd is a retrace of 1st by 38%-61.8% or more but never 100%
3rd is the next advance having gathered strength in 1st & pausing in 2nd and thus with great strength
1st is an advance
2nd is a retrace of 1st by 38%-61.8% or more but never 100%
3rd is the next advance having gathered strength in 1st & pausing in 2nd and thus with great strength
4th is the retrace of 3rd advance by 38% to 61.8% but never touching the 1st top
5th is the last advance, having seen the potential of 3rd & wanting to out beat the 3rd with such force, it generally a vertical rise, highly speculative.
5th is the last advance, having seen the potential of 3rd & wanting to out beat the 3rd with such force, it generally a vertical rise, highly speculative.
After 5, an "ABC" correction follows retracing 38%-61.8% of entire rise from 1st to 5th.
Generally, this retrace enters the range of 3rd to 4th wave as you can see in #Kotakbank chart
Before we end this beginner step, Know this:
12345 & abc are found all time frames 5 min-month
Generally, this retrace enters the range of 3rd to 4th wave as you can see in #Kotakbank chart
Before we end this beginner step, Know this:
12345 & abc are found all time frames 5 min-month

Take your time to spot waves in stocks and indices.
#Tradingview allows to mark labels easily & you can reject & relabel as new prices reveal more clarity.
Let Mkt correct you
Learn.. Learn.. with simple baby steps & Earn
You have all the TIME but allocation is by YOU & you alone
#Tradingview allows to mark labels easily & you can reject & relabel as new prices reveal more clarity.
Let Mkt correct you
Learn.. Learn.. with simple baby steps & Earn
You have all the TIME but allocation is by YOU & you alone
• • •
Missing some Tweet in this thread? You can try to
force a refresh


