
I wanted to share this $ZIL trade with you so that you can hopefully learn some fundamental Price Action concepts
Here we'll explore:
- The Range
- FVG
- nPOC
- MSB
- Entry
- Psychology
Use these methods on $BTC any #cryptocurrency from $ETH, $SOL, $MATIC, $FTM $SHIB
Here we'll explore:
- The Range
- FVG
- nPOC
- MSB
- Entry
- Psychology
Use these methods on $BTC any #cryptocurrency from $ETH, $SOL, $MATIC, $FTM $SHIB


Range:
I started off with drawing the range
You can see the notations on the drawings. Basically, I'm looking for the market structure before the sell off, and then the wicked candle that shows a liquidity tap that we assume will be run
I started off with drawing the range
You can see the notations on the drawings. Basically, I'm looking for the market structure before the sell off, and then the wicked candle that shows a liquidity tap that we assume will be run

FVG:
Then we're looking for a FVG, Fair Value Gap, where price trades through an area very quickly, leaving a 'gap' that opposite trending PA will 'fill'.
This occurs on any timeframe as price is fractal
Then we're looking for a FVG, Fair Value Gap, where price trades through an area very quickly, leaving a 'gap' that opposite trending PA will 'fill'.
This occurs on any timeframe as price is fractal

nPOC:
Using Value Area Trading, or the VPSV tool on @tradingview, we can see that there is a Naked Point of Control that is at the top of the FVG.
This is where price spent the most amount of time within the previous day's session.
There is a lot of interest in these areas
Using Value Area Trading, or the VPSV tool on @tradingview, we can see that there is a Naked Point of Control that is at the top of the FVG.
This is where price spent the most amount of time within the previous day's session.
There is a lot of interest in these areas
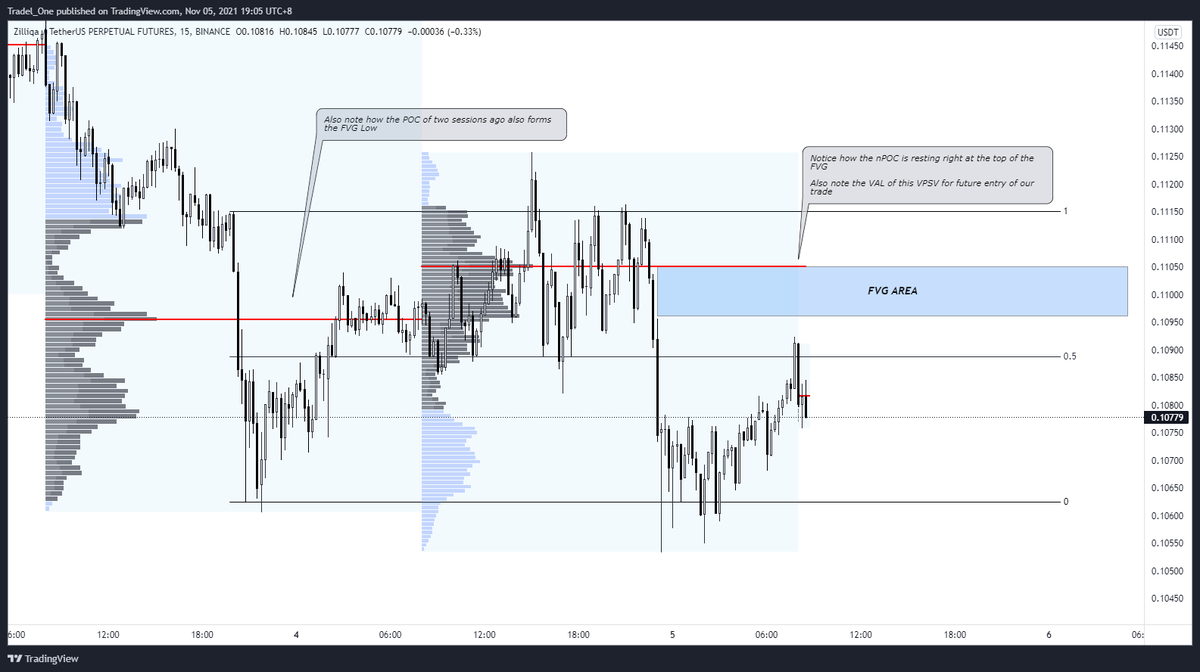
MSB:
Market Structure Break is where we have a swing high violated (or swing low), where we then expect a retest before price is assumed to continue in a trend or a reversal
(also note that our future entry aligns with the VAL of the previous session too)
Market Structure Break is where we have a swing high violated (or swing low), where we then expect a retest before price is assumed to continue in a trend or a reversal
(also note that our future entry aligns with the VAL of the previous session too)

Entry:
We see price recede from the top of the range to the low, sweeping the lows on the way through.
Price then dances at range low, before impulsively breaking a local swing high, where we can then assume that we can make an entry to the targets of the FVG and nPOC
We see price recede from the top of the range to the low, sweeping the lows on the way through.
Price then dances at range low, before impulsively breaking a local swing high, where we can then assume that we can make an entry to the targets of the FVG and nPOC


Psychology:
You can see that with the entry made, that there are several areas along the trade that could change your mind about your idea.
You just got to keep that conviction though and stick with the idea as price is drawn to liquidity at the nPOC
You can see that with the entry made, that there are several areas along the trade that could change your mind about your idea.
You just got to keep that conviction though and stick with the idea as price is drawn to liquidity at the nPOC


Result
Price rallied to fill the gap, reaches range high, smashed the nPOC, & the trade was a successful 2.48R
An enjoyable trade when sticking to your guns with the trading idea you have & watching it unfold
Thanks @Delta_Exchange for a great trade on a great exchange
Price rallied to fill the gap, reaches range high, smashed the nPOC, & the trade was a successful 2.48R
An enjoyable trade when sticking to your guns with the trading idea you have & watching it unfold
Thanks @Delta_Exchange for a great trade on a great exchange

So that's it folks - just wanted to show that with some logical thinking & PA principles, we can all hopefully be smashing it like @RektProof soon!
Thanks for stopping by; you know the drill - say g'day to the old chook for me, & have a great weekend!
🍻🤝
Thanks for stopping by; you know the drill - say g'day to the old chook for me, & have a great weekend!
🍻🤝
• • •
Missing some Tweet in this thread? You can try to
force a refresh


