With trading, you've got to think like the market maker, rather than what the crowd looks for with #Crypto
So here's my interpretation of a couple of possible $BTC plays.
Agenda:
- Overview
- Premium / Discount
- FRVP
- nPOC
- Support / Resistance
- FVG
- Plays
- Wrap up
So here's my interpretation of a couple of possible $BTC plays.
Agenda:
- Overview
- Premium / Discount
- FRVP
- nPOC
- Support / Resistance
- FVG
- Plays
- Wrap up

Overview:
$BTC has retraced after hitting ATH just recently.
We saw a range form, followed by a liquidity grab for sell stops, up to buyside stops in the form of range deviations
$BTC has retraced after hitting ATH just recently.
We saw a range form, followed by a liquidity grab for sell stops, up to buyside stops in the form of range deviations

Premium / Discount:
With regard to an overall range from the ATH to the current range low, we can explore the concept of discount and premiums.
Mid range is seen as fair value, with anything less than this a discount, and anything more, price being at a premium
With regard to an overall range from the ATH to the current range low, we can explore the concept of discount and premiums.
Mid range is seen as fair value, with anything less than this a discount, and anything more, price being at a premium

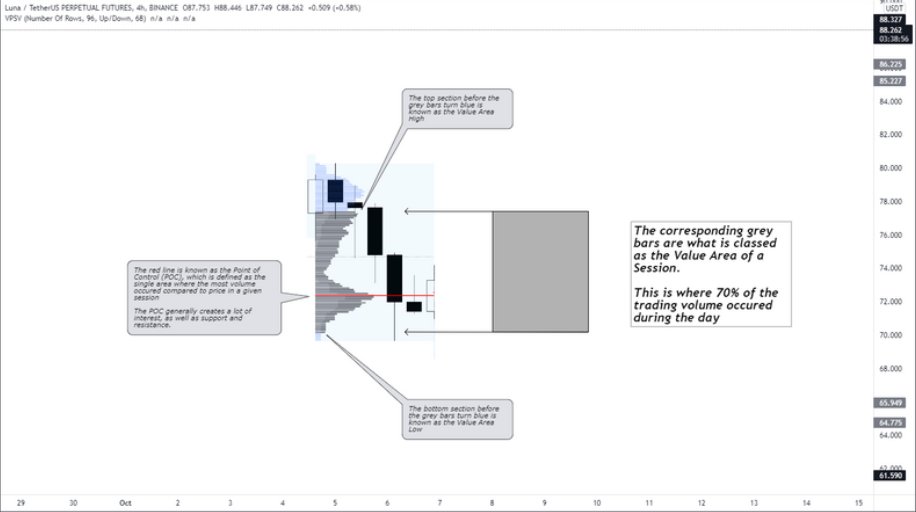
FRVP:
We can see that the FRVP confirms to a certian degree, the location that we've placed our range
Price currently trades above the POC, and around a subsequent node, while also looking to recover the local mid range
We can see that the FRVP confirms to a certian degree, the location that we've placed our range
Price currently trades above the POC, and around a subsequent node, while also looking to recover the local mid range

nPOC:
Above current price, rests a singular nPOC at the ~$65k mark
Below price, there are a series of nPOC's closer down to the $56k, $51k, & $50k levels
These levels hold a lot of confluence as we explore in this thread
Above current price, rests a singular nPOC at the ~$65k mark
Below price, there are a series of nPOC's closer down to the $56k, $51k, & $50k levels
These levels hold a lot of confluence as we explore in this thread

Support / Resistance:
In the form of resistance, we can see that we have the following:
- nPOC at $65k
- VAH at $65k
- 0.786 overall fib
In the form of resistance, we can see that we have the following:
- nPOC at $65k
- VAH at $65k
- 0.786 overall fib


Support:
From an overall perspective, there is a lot of support in the form of:
- nPOC's as shown in the chart
- 0.618 fib level
- note that 0.618 and 0.702 levels hold two nPOC's as well
From an overall perspective, there is a lot of support in the form of:
- nPOC's as shown in the chart
- 0.618 fib level
- note that 0.618 and 0.702 levels hold two nPOC's as well

FVG:
There is a run through resistance, with no closeback (via body or wick) at the $52.8k to $53.3k range
Typically, we see these areas filled again, but not always immediately (or ever in some cases)
To also frame it, the FVG rests just below the mid range of the global move
There is a run through resistance, with no closeback (via body or wick) at the $52.8k to $53.3k range
Typically, we see these areas filled again, but not always immediately (or ever in some cases)
To also frame it, the FVG rests just below the mid range of the global move

Plays:
There are of course a myriad of plays here, but here's some that could wholly or partially play out
1. Hit the $65k nPOC / resistance and reject or continue
2. Or, after the $65k nPOC grab, price heads South to retest the lower nPOC's and FVG
There are of course a myriad of plays here, but here's some that could wholly or partially play out
1. Hit the $65k nPOC / resistance and reject or continue
2. Or, after the $65k nPOC grab, price heads South to retest the lower nPOC's and FVG


Wrap Up:
Do I know either way? Of course I don't, but I can only really show, based on some logical reasoning, how these plays could be attracted to these areas of interest
You've got to have a plan, so hopefully this helps you on your journey, and feel feel to give it a share
Do I know either way? Of course I don't, but I can only really show, based on some logical reasoning, how these plays could be attracted to these areas of interest
You've got to have a plan, so hopefully this helps you on your journey, and feel feel to give it a share
Thanks for your time guys, & hope you smash it either way in the coming months
Thanks to @Delta_Exchange for their ongoing support too!
If you'd like to trade there, use the below link to score a discount on fees (no drama either way)
Cheers guys
🤝🍻
delta.exchange/MindsetBTC
Thanks to @Delta_Exchange for their ongoing support too!
If you'd like to trade there, use the below link to score a discount on fees (no drama either way)
Cheers guys
🤝🍻
delta.exchange/MindsetBTC
• • •
Missing some Tweet in this thread? You can try to
force a refresh