Quick 5M PA breakdown of $MATIC.
I wanted to share this with you to show how a narrative can be built.
You know the drill, you can use this across #cryptocurrencies or any market, from $BTC, $ETH, $SOL $OMG $DOGE, hell, even $SHIB (shameless tags!)
Let's take a look:
I wanted to share this with you to show how a narrative can be built.
You know the drill, you can use this across #cryptocurrencies or any market, from $BTC, $ETH, $SOL $OMG $DOGE, hell, even $SHIB (shameless tags!)
Let's take a look:

The first key item to be drawn to here is the double bottom at range low.
Traders place their stops just below these levels, assuming that price will rise, which creates a liquidity pool which is subsequently taken out for a move upwards.
Traders place their stops just below these levels, assuming that price will rise, which creates a liquidity pool which is subsequently taken out for a move upwards.
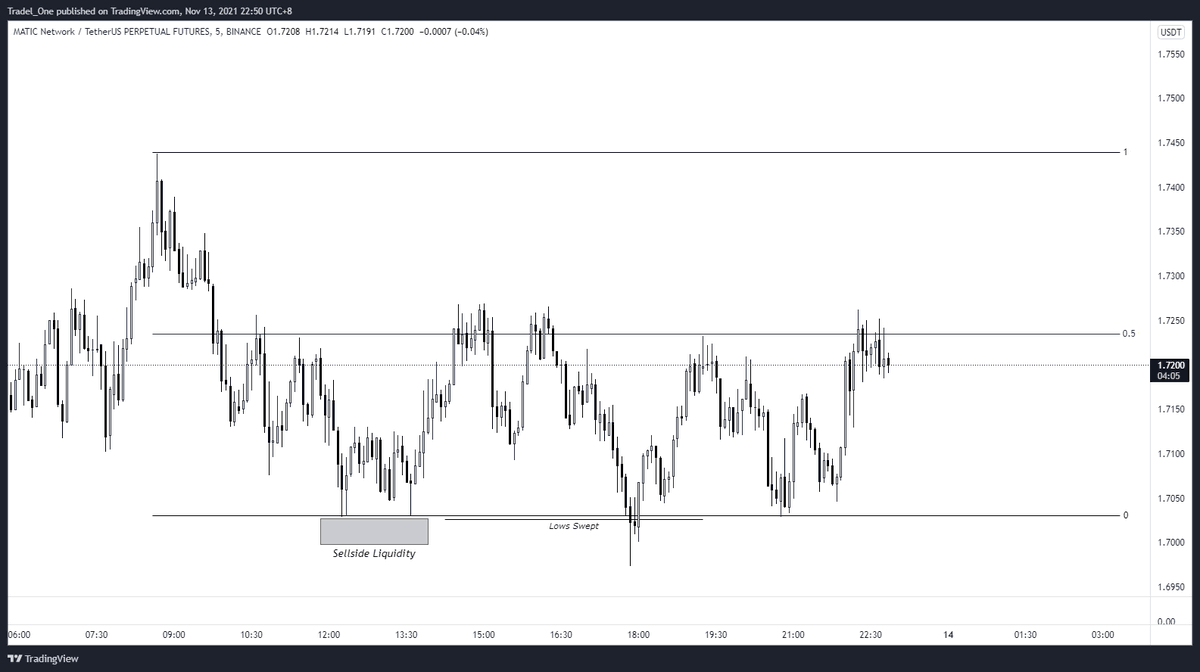
We can then see just above mid range, that a Fair Value Gap is apparent, even though price has traded close to filling this area.

Similar to the double bottom, but inversley, short sellers who entered at these tops would have placed their stops in the form of buyside liquidity above this area

With the FVG and also buyside liquidity resting above the double top, we can expect price to rally up to these levels to fill the gap, and to also take the short seller buyside liquidity stops.
You'll notice an MSB into fibs makes the way for the move up
You'll notice an MSB into fibs makes the way for the move up

And literally as I'm writing this last tweet, price has ran the double top for liquidity.
Simple Price Action concepts that can be used on any timeframe by anyone at all.
No indicators, no mess; just a simple mark up and set up
Simple Price Action concepts that can be used on any timeframe by anyone at all.
No indicators, no mess; just a simple mark up and set up

Thanks for stopping by - hopefully you've found some insightful info from my ongoing ramblings.
Thanks as always to @Delta_Exchange for helping me bring this to you as well
Please, pass this on to someone if it helps, and say hi to your mum for me!
Cheers - stay hungry🤝
Thanks as always to @Delta_Exchange for helping me bring this to you as well
Please, pass this on to someone if it helps, and say hi to your mum for me!
Cheers - stay hungry🤝
• • •
Missing some Tweet in this thread? You can try to
force a refresh