Coming out of COP26, I yearn for a general theory of emissions reductions. I don’t want to talk about ambition, bending the curve, or what countries are proposing to do. I want to talk about *performance*. Are emissions falling? Where? How much? Why?

A thread.
Let me start with my favorite example: California, a state widely seen as a climate leader. Do you know how much California reduced CO2 emissions between 2005 and 2018? 8 percent. Same as Florida. Yes, there are caveats. But still: 8 percent?? Not exactly impressive…
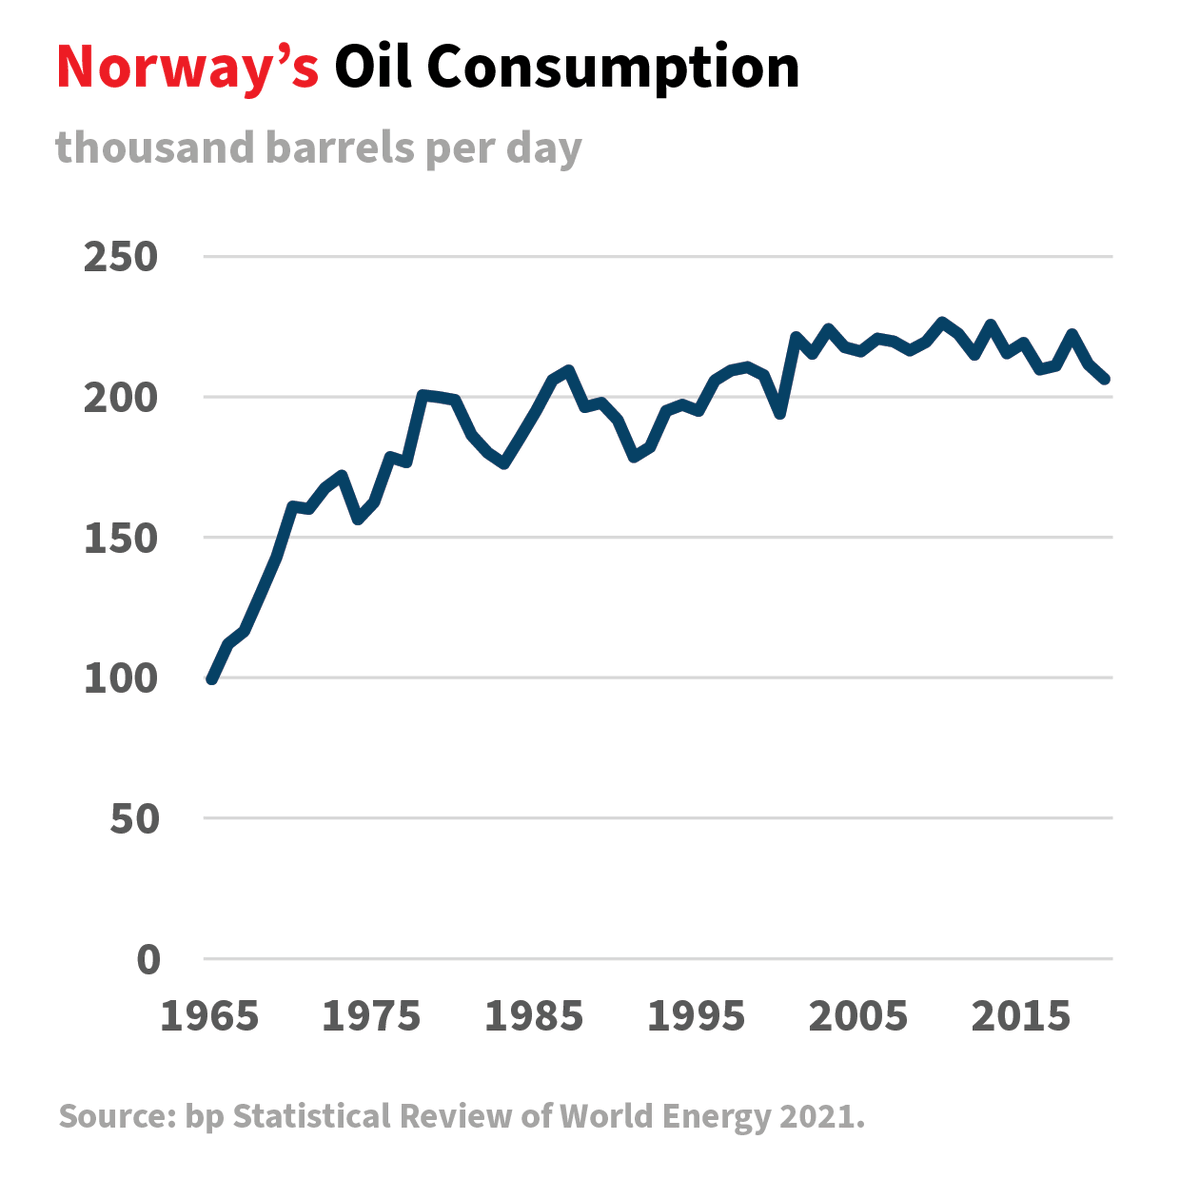
Here is Norway’s oil consumption, the leading market for EVs. Barely a dent visible. I don’t want to minimize Norway’s record in EVs. I wish we could all be like Norway. Over time, it will make a difference. But my point is: look at the math that really matters. It’s unforgiving.
Here is the United States. Emissions from electricity are down. But everywhere else: basically nothing. No progress in reducing emissions. This is the track record. This is the baseline. This is what we’re trying to change.
So how do we lower CO2 emissions? There are three ways: changes in activity (don’t do the thing that emits CO2); more efficiency (use less energy in doing the thing); or fuel switching (emit less carbon in doing the thing).
So what has lowered emissions? Changes in activity sure have. There are huge shifts in industrial production, for example, that lowered energy use and emissions. But lowering the activity itself only takes you so far. It’s an option for limited applications (e.g. urban mobility).
Efficiency has lowered emissions. But efficiency is good at breaking the link between activity and emissions—getting more for fewer emissions. We use less energy to move a car, heat a home, power a factory. But it doesn’t have a great track record in *reducing* emissions.
Most emissions reductions come from fuel switching. Some fuel switching comes when a new, cheaper option undercuts the incumbent. Even then, it takes time. Gas and renewables decimated coal in the United States. But coal is still 20 percent of the mix 15 years after the peak.
More often, fuel switching is the product of policy design. The shift away from oil in the 1970s or the boost for renewables in the last 15 years. It comes from a willingness to pay for the lower-carbon option over the existing system. It’s the *surest* strategy for change.
And so a lot of the things we focus on—finance, subsidies, regulations, carbon pricing, coalitions—they matter, of course, but they depend on an arc of governments favoring, usually with real money, the lower-carbon option. Without that push, you get slow, incremental change.
What do you at home matters more than what you say or negotiate in Glasgow. So I don’t put too much stock on whether countries agree to phase out or phase down coal. How they qualify their policy on subsidies. Or even whether they can agree on much at all.
We don’t need collaboration as much as we need alignment in climate policy. Synchronicity. If countries are supporting the same technologies at the same time, that creates a bigger market, which in turn can generate economies of scale that reduce costs. That’s the goal.
So if I am optimistic, it’s because I see governments willing to act. Willing to spend real money. Eager to chase the opportunities associated with the transition. That’s the kind of action I can plausibly link to emissions reductions. That’s what the record shows. Fin.

• • •

Missing some Tweet in this thread? You can try to force a refresh
 

Keep Current with Nikos Tsafos

Nikos Tsafos Profile picture

Stay in touch and get notified when new unrolls are available from this author!

Read all threads

This Thread may be Removed Anytime!

PDF

Twitter may remove this content at anytime! Save it as PDF for later use!

Try unrolling a thread yourself!

how to unroll video
  1. Follow @ThreadReaderApp to mention us!

  2. From a Twitter thread mention us with a keyword "unroll"
@threadreaderapp unroll

Practice here first or read more on our help page!

More from @ntsafos

15 Oct
LOVE this cover!
But the content—so many issues...
Let me just pick a few. Image
What the article says: “Britain, the host of the [COP 26] summit, has turned its coal-fired power stations back on.”

What the data on coal-fired generation actually looks like. Image
I am also struck by the persistence of this idea that underinvestment in gas is the problem. The statement “Too few [LNG] projects are coming on stream” is not quite right. Here is what investment in new LNG projects looks like. Image
Read 7 tweets
14 Oct
Countries are making big bets on the technologies we need for the energy transition, unlocking enormous opportunity, but also creating the prospect of trade and other conflicts. @CSISEnergy is launching “Energy Rewired” to study how these bets will change the world's energy map. Image
To start with, we will publish country briefs that focus on specific technologies like solar, wind, hydrogen, batteries, CCUS and others. We ask three questions: What is the country’s vision? What is the strategy? What is the geographic focus?
Over time, as we build the data, we plan to tackle higher order questions: which countries might pull ahead? What can we learn from each other? What conflicts or tensions might arise? How can the United States and its partners safeguard their interests in this world?
Read 4 tweets
13 Oct
With every new WEO come a gazillion new ideas to reflect on and write about. This is no summary of the main points, but some of the data points I found particularly interesting. A thread on the @IEA WEO 2021:
First, we are witnessing a profound transformation in the geopolitics of energy. By 2050, the geopolitics of energy will mean critical minerals and hydrogen rather than oil and gas. This is what we will trade. This is a big part of what we will need to manage across borders.
Having said that, the geography of hydrogen will not merely follow the geography of gas. It is too soon to speculate on trade routes for hydrogen by 2050, but this graph makes a key point: hydrogen trade routes will likely be limited. Think about hydrogen in its own terms.
Read 11 tweets
6 Oct
Gas is getting a lot of flak in today’s energy crisis—and for good reason. This is a genuine gas crisis. But the criticism can also miss a deeper truth: gas has a really tough assignment. The hardest, in fact. Let’s talk about *seasonal* balancing.
We often think of gas as balancing intermittent renewables, and sure it can do that. But its chief function in many modern economies is to manage seasonal variations in demand. And these can huge.
In the UK, for example, the winter/summer spread for gas demand is over 2x. For electricity the ratio is about 35 percent. This is fairly typical in countries where gas is used for space heating (in the U.S., the gas spread is about 75 percent, electricity about 35 percent).
Read 9 tweets
5 Jan
For years, I distrusted sidewalks. I grew up in Athens, where sidewalks are cramped, cracked, or just missing. I learned to walk on the street, something I had to “un-learn” after moving overseas. But I spent time in Athens recently, and it all came back. A thread—on sidewalks.
First rule: sidewalks are *not* for pedestrians. They function chiefly as overflow parking. If there is enough space on the sidewalk, a car or motorcycle will appear. Vehicles win—every time. (Photos taken around Alimos and Palaio Faliro.)
The next barrier is the trash can. The urban planner has often firmed its place on the sidewalk with this little insert. Good luck squeezing past these guys.
Read 10 tweets
8 Dec 20
Whenever I write about Turkey and the East Med, I get a gazillion replies with the same message: look at this MAP! So many problems can be traced to this map—and the feeling it is meant to create that Turkey is a victim in the East Med. Let’s talk about this map.
To begin with, it’s not really a map of “Greek claims in the eastern Med.” Greek officials do not show this map. In fact, they rarely show maps at all. You won’t find it in official documents. This map is a derivation; it is not an official, stated “claim.”
This map is an academic exercise about what a median-line approach to exclusive economic zones (EEZ) might look like. It is based on the idea that absent any agreement to the contrary, each island gets the full EEZ that it is entitled to by international law. That’s it.
Read 16 tweets

Did Thread Reader help you today?

Support us! We are indie developers!


This site is made by just two indie developers on a laptop doing marketing, support and development! Read more about the story.

Become a Premium Member ($3/month or $30/year) and get exclusive features!

Become Premium

Too expensive? Make a small donation by buying us coffee ($5) or help with server cost ($10)

Donate via Paypal

Thank you for your support!

Follow Us on Twitter!

:(