📣📣 It's been several months, so it's time once again to look at the *county-level* COVID vaccination rates of all 50 states by 2020 partisan lean.
As always, these graphs only include county residents who've received 2 Pfizer/Moderna or 1 J&J dose (boosters not included yet).
As always, these graphs only include county residents who've received 2 Pfizer/Moderna or 1 J&J dose (boosters not included yet).
📣📣 Other important caveats:
--Every state has a small percent of total vaccinated residents whose county of residence is unknown; those aren't included here.
--The vaccination rates are out of the TOTAL population, not just adults/over 12/over 5.
--Every state has a small percent of total vaccinated residents whose county of residence is unknown; those aren't included here.
--The vaccination rates are out of the TOTAL population, not just adults/over 12/over 5.
ALABAMA: 

ALASKA. Note that Bristol Bay only has 844 residents.

ARIZONA. Pretty strong partisan correlation here. Also note that ~60% of the total state population is in Maricopa County, which skews the results.

ARKANSAS.

CALIFORNIA. Yeah, that's a pretty steep slope & a pretty strong correlation, I'd say.

COLORADO. Whoa.

CONNECTICUT, DELAWARE, DC, HAWAII & RHODE ISLAND: None of these have more than 8 counties/county-equivalents, so I'm lumping them together.
Note that Kalawao County, HI only has 82 residents, all of whom are either former Hanson's Disease victims or healthcare workers.
Note that Kalawao County, HI only has 82 residents, all of whom are either former Hanson's Disease victims or healthcare workers.

FLORIDA. Important:
1. Miami-Dade: The vaxx rate of actual *residents* is almost certainly significantly lower than shown (see link): acasignups.net/21/11/16/snowb…
2. Sumter: This is home of The Villages, the massive MAGA senior/retirement community.
1. Miami-Dade: The vaxx rate of actual *residents* is almost certainly significantly lower than shown (see link): acasignups.net/21/11/16/snowb…
2. Sumter: This is home of The Villages, the massive MAGA senior/retirement community.

GEORGIA.

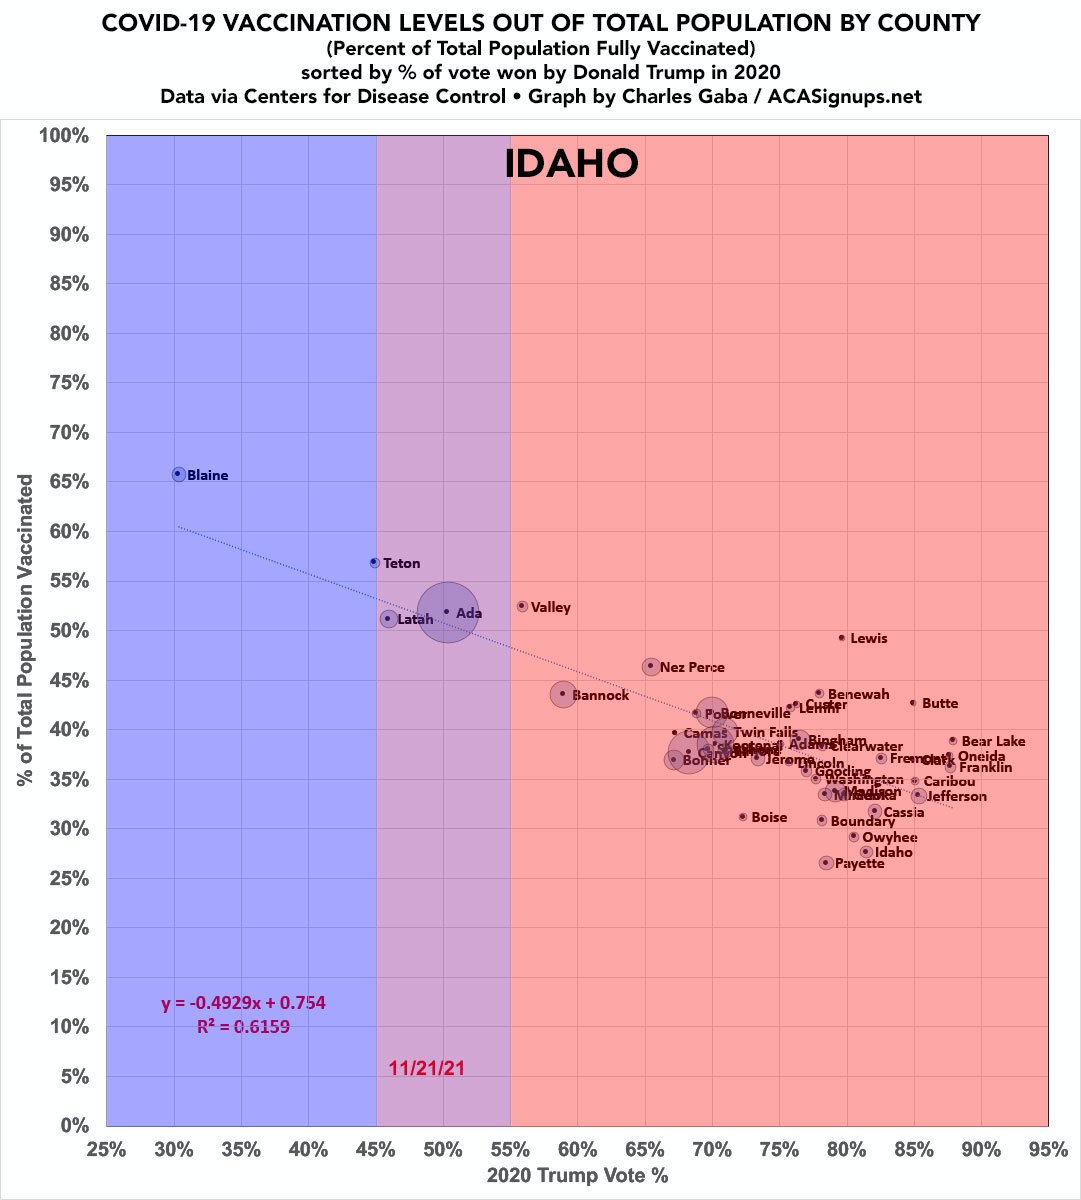
IDAHO.
ILLINOIS.

INDIANA.

IOWA.

KANSAS. I seem to recall reading an article about how Graham County managed to have a very successful vaccination program despite being deep red a few months back.

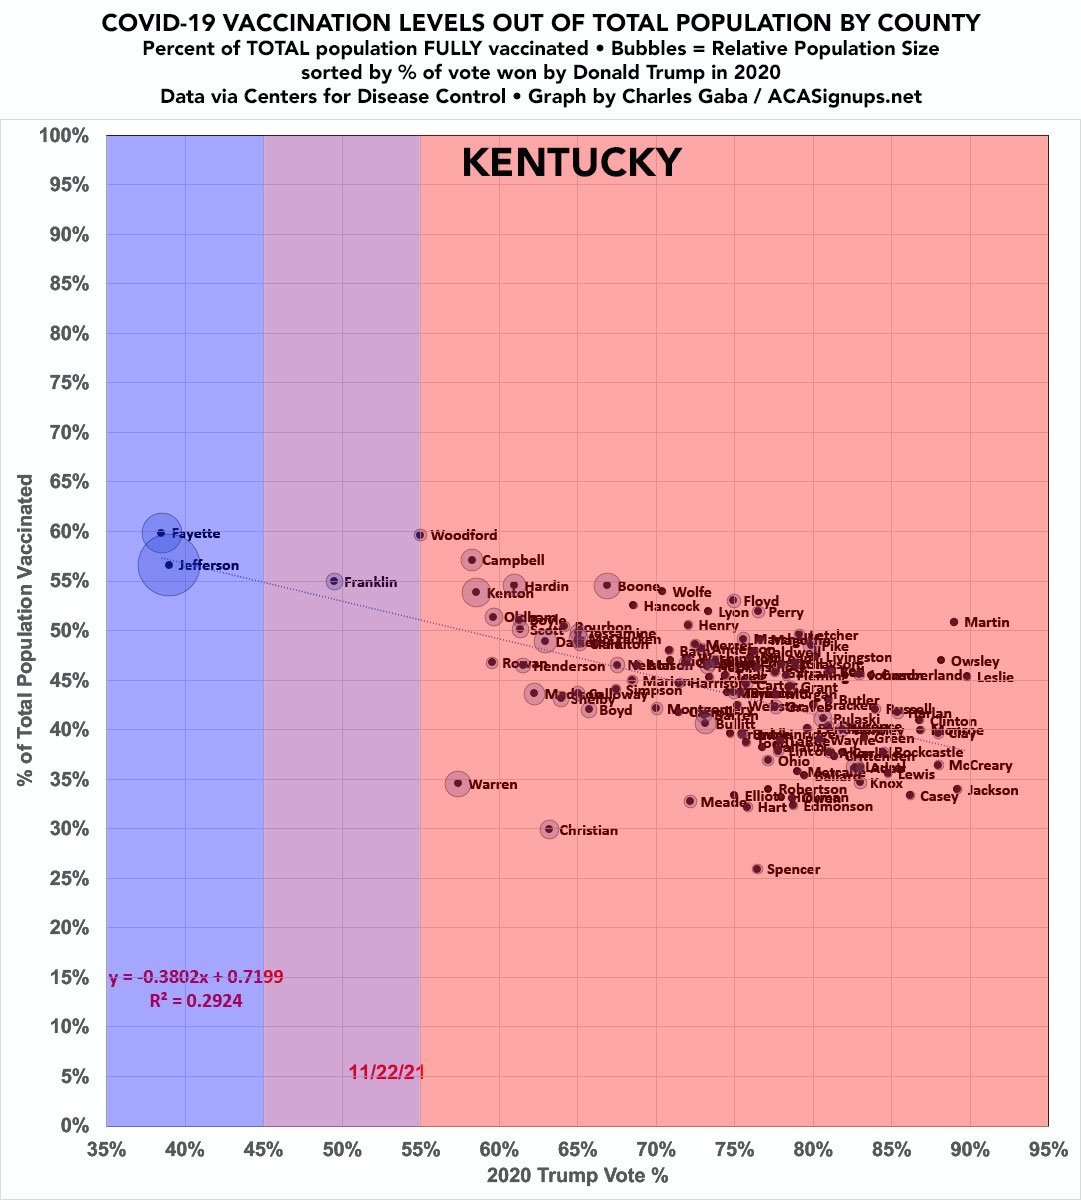
KENTUCKY.
LOUISIANA. I've never gotten a straight answer about how what's going on in West Feliciana Parish other than it being home to the LA State Penitentiary (which has 1/3 of the population)?

MAINE. The slope is shallow but check out that R^2 correlation...nearly a straight shot.

MARYLAND. Montgomery County is kicking ass.

MASSACHUSETTS. Even in a completely blue state, there's *still* a slight partisan pattern.
Note that Dukes & Nantucket are *both* 93% fully vaxxed, according to state health dept. data. Being island resorts I assume they don't have many children as permanent residents?
Note that Dukes & Nantucket are *both* 93% fully vaxxed, according to state health dept. data. Being island resorts I assume they don't have many children as permanent residents?

My home state of MICHIGAN.
Wayne County (home of Detroit) is troubling.
Wayne County (home of Detroit) is troubling.

MINNESOTA.

MISSISSIPPI. COVID-19 has killed 1 out of every 290 residents of the state, yet only a single county has vaccinated more than 60% of its population.

MISSOURI. Remember that St. Louis City is a separate census area from St. Louis County.

📣 OK, that's the first half of the states...I should be adding Montana - Wyoming to this thread later this afternoon.
I'll also be running the county-level *death rates since June* for every state later this week for comparison.
I'll also be running the county-level *death rates since June* for every state later this week for comparison.
Sorry, the other half will have to wait until tomorrow…
📣 OK, HERE'S PART TWO...
MONTANA:
MONTANA:

NEBRASKA:

NEVADA (again, keep in mind that Clark County holds 73% of the total state population):

NEW HAMPSHIRE: Only 10 counties, so not many data points to work with:

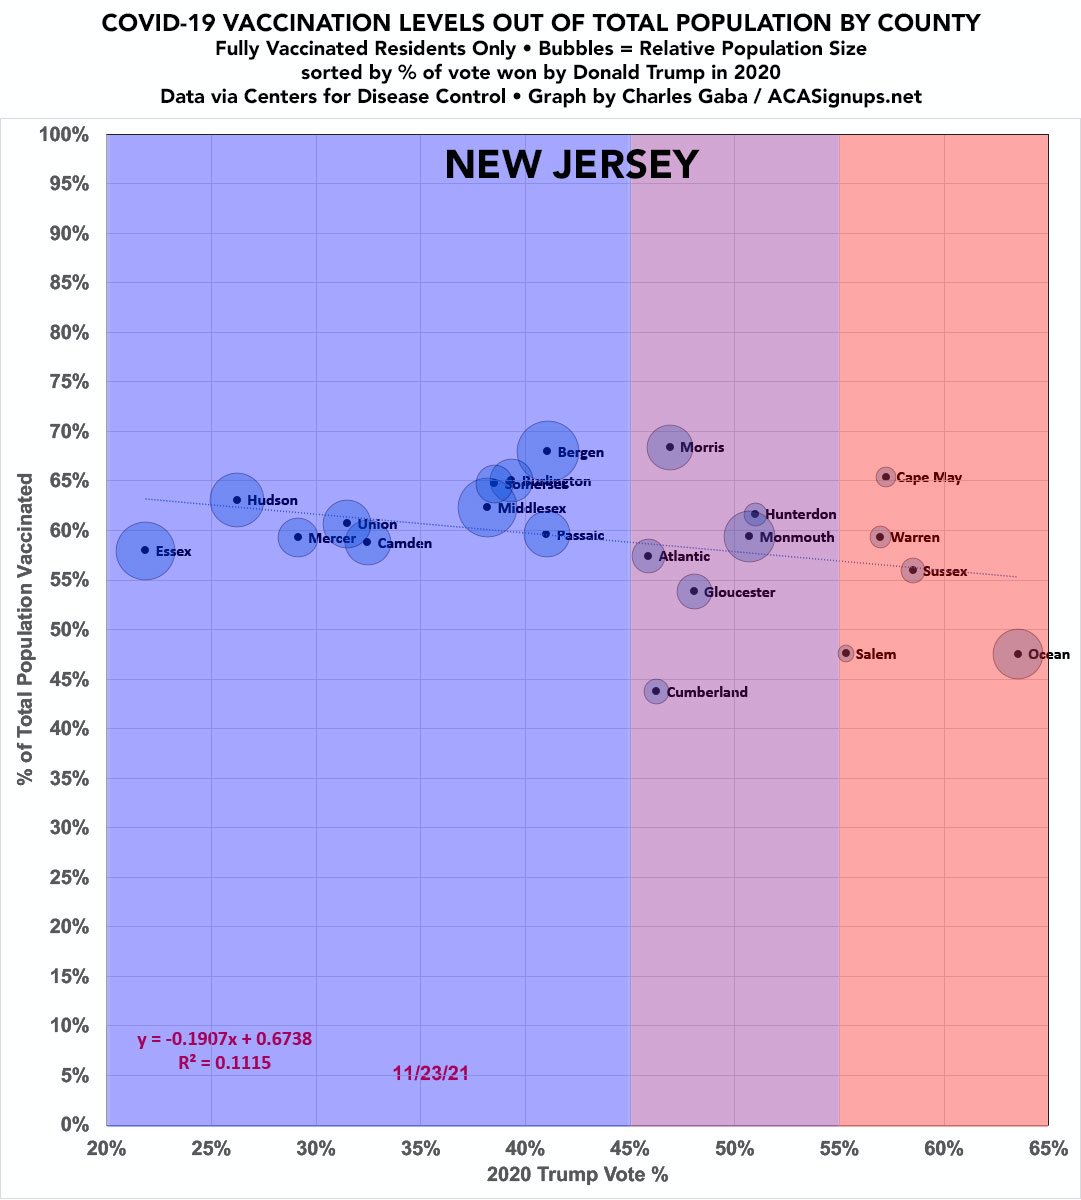
NEW JERSEY:
NEW MEXICO. R^2 of nearly 0.8.

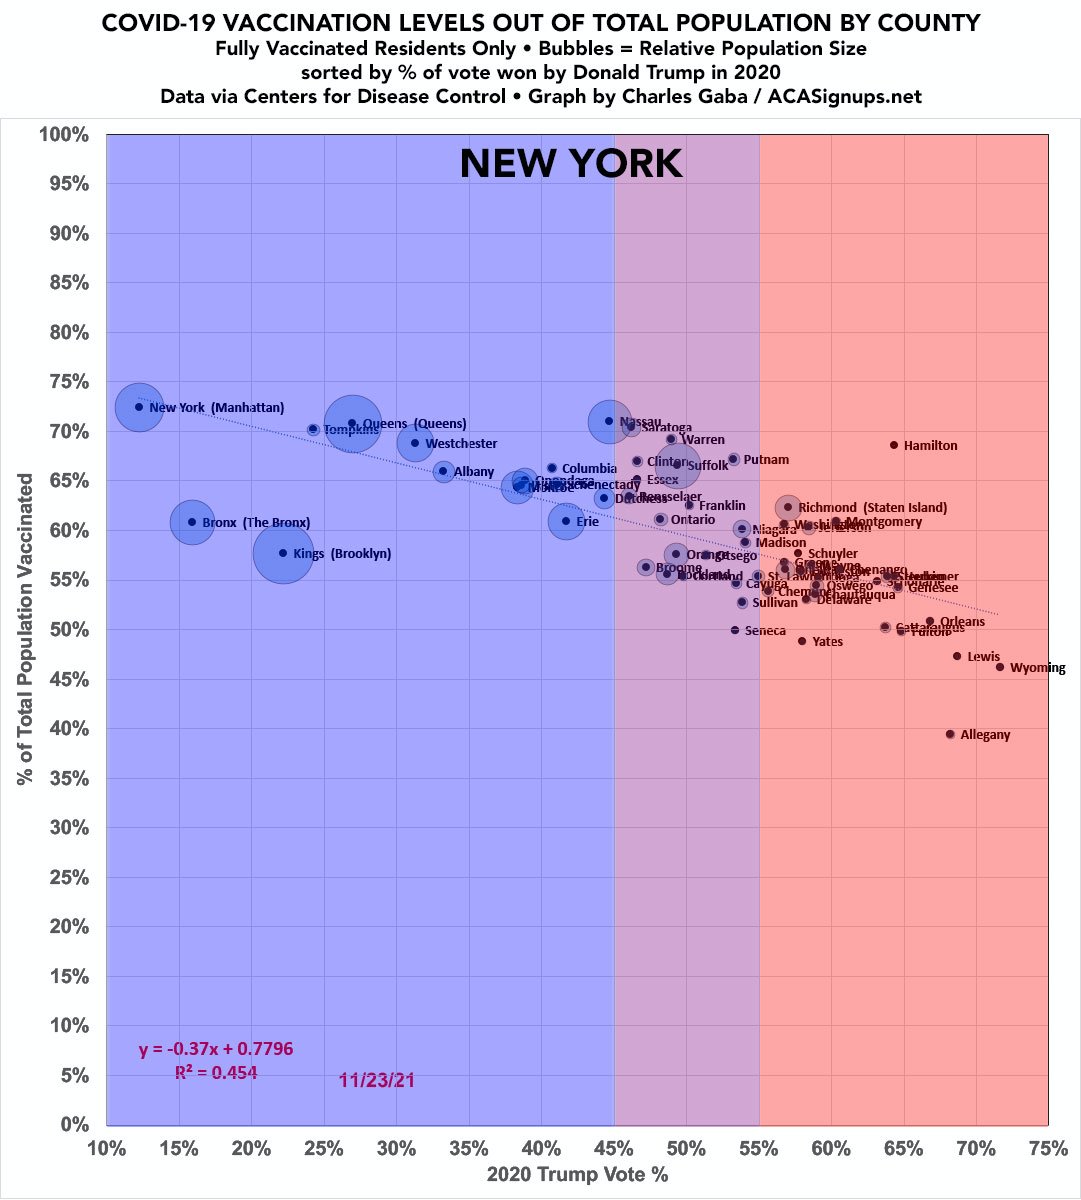
NEW YORK. Brooklyn & The Bronx need to step it up.
NORTH CAROLINA: Not sure what's up with Hoke County?

NORTH DAKOTA: Most other heavily Native American counties have an extremely *high* vaccination rate, but Sioux County is lagging. Not sure why.

OHIO. Holmes County is just sad.

OKLAHOMA:

OREGON: Take Baker County out of the equation and that's about as straight a line as you'll see.

PENNSYLVANIA:

SOUTH CAROLINA:

SOUTH DAKOTA:

TENNESSEE:

TEXAS: Yeah, I know you can't read most of the county names; TX has 254 of them.
I'm scratching my head about Hudspeth County, but good for them, assuming this isn't a data glitch (it comes from the state health dept):
I'm scratching my head about Hudspeth County, but good for them, assuming this isn't a data glitch (it comes from the state health dept):

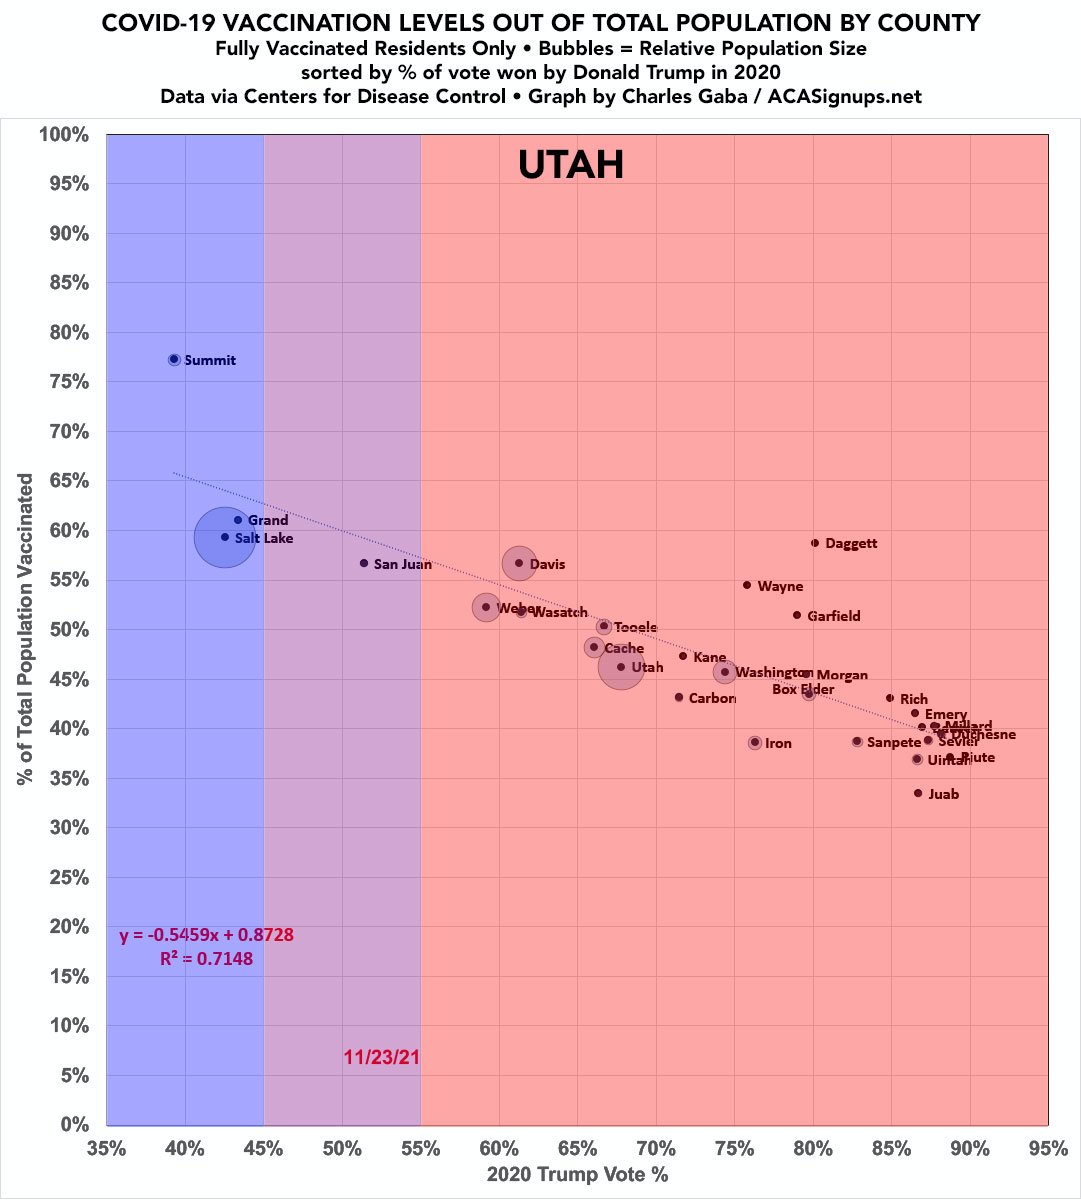
UTAH:
VERMONT:

VIRGINIA: I think VA is the only state which has both a) a large number of counties/county-equivalents and b) not much of a partisan pattern. Might be connected to their unusual system of half the "counties" being cities?

WASHINGTON STATE:

WEST VIRGINIA. Believe it or not, WV *led* the nation in vaccinations back in March...today it's dead last.

WISCONSIN:

Finally, WYOMING. R-squared: 0.8467.
I call this the "Thor's Twins" graph after the famous scene from The Hunt for Red October.
I call this the "Thor's Twins" graph after the famous scene from The Hunt for Red October.

📣 PUT ALL 3,144 COUNTIES TOGETHER AND HERE'S AMERICA AS OF NOVEMBER 2021:

If you find my work useful & want to support it, you can do so here, thank you!
acasignups.net/support
acasignups.net/support
📣 UPDATE: Here's the weekly county-level *national* graph with additional details:
acasignups.net/21/11/23/weekl…
acasignups.net/21/11/23/weekl…
• • •
Missing some Tweet in this thread? You can try to
force a refresh