Zoom $ZM 3Q22 Earnings 💪🏻
- Rev $1.05b +35% ↗️
- GP $778m +50% ↗️ margin 74% +750bps ✅
- NG EBIT $411m +41% margin 39% +1728bps ✅
- NG Net Income $338m +14% margin 39% ⭐️ +173bps ✅
- OCF $395m -4% ↘️ margin 38% ⭐️ -1539bps ↘️
- FCF $375m -3% ↘️ margin 36% ⭐️ -1428bps ↘️ Image
➡️ $ZM Strong Business Metrics 💪🏻

- 26% incremental rev from existing cust
- Cust > TTM $100k 2,507 +94% 🚀
- Cust >10 staff 512K +18% ↗️
- TTM NDER (>10) >130% 14th cons Q ⭐️

- 4Q22 Rev Guide Flat QoQ $1.05b ➡️
- 4Q33 NDRR to be modestly below 130% mark ➡️
1 | Q4 - Lowest Seasonality

“…for deferred revenue there's two things to remember, which is the seasonality trend of our renewals is that Q1 is the largest quarter for renewals order for renewals and Q4 is the lowest.”
2 | Advertising - More to Explore

“Zoom still offers good value, obviously, we got to do think about how to monetize it differently. Again, this is something new for us, and we would like to explore more in the next few quarters.”
3 | ROW growing faster than Americas

- Rev Americas $700m +30%
- Rev ROW $350m +47% Image
4 | Very Strong RPO Growth (even faster than revenue)
- RPO $2.5b +51% ↗️↗️
- Current RPO $1.6b +38% ↗️
- Non-Current RPO $822m +82% 🚀

If one is focused on just “slower” near-term growth, they are missing the “longer-term” aspect. Image
4 | Very Strong RPO Growth (cont’d)

“We expect to recognize ~67% of the total RPO as revenue over the next 12 months as compared to 72% in 3Q21 , reflecting a shift back towards longer-term plans.”
5 | Very Strong Cash Flows and Cash Position Image
6 | Zoom’s $ZM stock price is down from all-time-highs. Image
7 | Arguably Zoom’s $ZM stock price has lagged the actual business fundamentals (growing revenues, profits and cash flows) in the near-term significantly.

Would be worth watching long-term, when this gap closes back up. Image
➡️ Final Takeaway on Zoom $ZM:

Strong combination of growth and very strong profitability, supported by product expansion (Phone, Apps, Events) to further strengthen the platform. Drawdown from ATH does not bother me, still holding it. Valuations are extremely undemanding.

• • •

Missing some Tweet in this thread? You can try to force a refresh
 

Keep Current with Eugene Ng

Eugene Ng Profile picture

Stay in touch and get notified when new unrolls are available from this author!

Read all threads

This Thread may be Removed Anytime!

PDF

Twitter may remove this content at anytime! Save it as PDF for later use!

Try unrolling a thread yourself!

how to unroll video
  1. Follow @ThreadReaderApp to mention us!

  2. From a Twitter thread mention us with a keyword "unroll"
@threadreaderapp unroll

Practice here first or read more on our help page!

More from @EugeneNg_VCap

24 Nov
Reflection.

With the Q3 earnings season nearing the end, and after doing numerous earnings reviews for my portfolio companies.

Here’s 10 of my biggest reflections and key takeaways 👇🏻:
1 | Fluctuations.

Not every businesses will do well every quarter.

There will be some quarters that they will do really well.

There will be some quarters, they won’t do so well, consolidating, reinvesting, pivoting.

There will be others indicating a long-term broader decline.
2 | Impairment.

If the business did not do well, was it only one quarter or many consecutive quarters?

If the former, take a chill pill & relax.

If more than a couple of quarters, is the business structurally deteriorating faster than expected?

Distinguish the difference.
Read 12 tweets
17 Nov
NVIDIA $NVDA 3Q22 Earnings💪🏻

- Rev $7.1b +50%↗️
- Gross Profit $4.6b +56% ↗️ margin 65% +260bps✅
- NG EBIT $3.4b +70% ↗️ margin 48%⭐️+550bps✅
- NG Net Income $3.0b +62% ↗️margin 42%⭐️+304bps✅
- OCF $1.5b +19% ↗️ margin 21% -568bps↘️
- FCF $1.3b +58% ↗️ margin 18% +90bps✅
➡️ $NVDA Revenues by Segment 💪🏻

- Gaming Rev $3.2b +42% ↗️⭐️
- Data Center Rev $2.9b +55% ↗️⭐️
- Visualization Rev $577m +144% 🚀
- Auto Rev $135m +8% ➡️
- OEM Rev $234m +21% ↗️
1 | Solid Q3

“The third quarter was outstanding, with record revenue. Demand for NVIDIA AI is surging, driven by hyperscale and cloud scale-out, and broadening adoption by more than 25,000 companies.”
Read 16 tweets
17 Nov
ZoomInfo $ZI 3Q21 Earnings

- Rev $198m +60% ↗️
- GP $160m +65% ↗️ margin % +246bps✅
- NG EBIT $78m +34% ↗️ margin 39%⭐️ -773bps↘️
- NG Net Income $51m +18% ↗️ margin 26% -903bps↘️
- 9M OCF $228m +122% 🚀 margin 43% ⭐️ +1294bps✅
- 9M FCF $263m +57% ↗️ margin 50% ⭐️ +40bps➡️
Business Metrics
- FY20 108% NRR
- Organic Rev Growth 54% vs 60%
- Cust >$100k Count >1,250 +70% ↗️
- Cust >$100k ACV +85% ↗️ (~40% of rev)
- International Rev $80m ARR (~11%) +80% ↗️

⭐️ Data Moat: Info on 150m business professionals and 100m companies.
1 | ❌📉 Adj EBIT Margin has been steadily declining, and likely to continue for now…

$ZI starting from a position of strength, digest acquisitions, continuing to invest in sales to drive growth, expect LT margins to eventually reverse back higher. For now, growth is priority.
Read 6 tweets
17 Nov
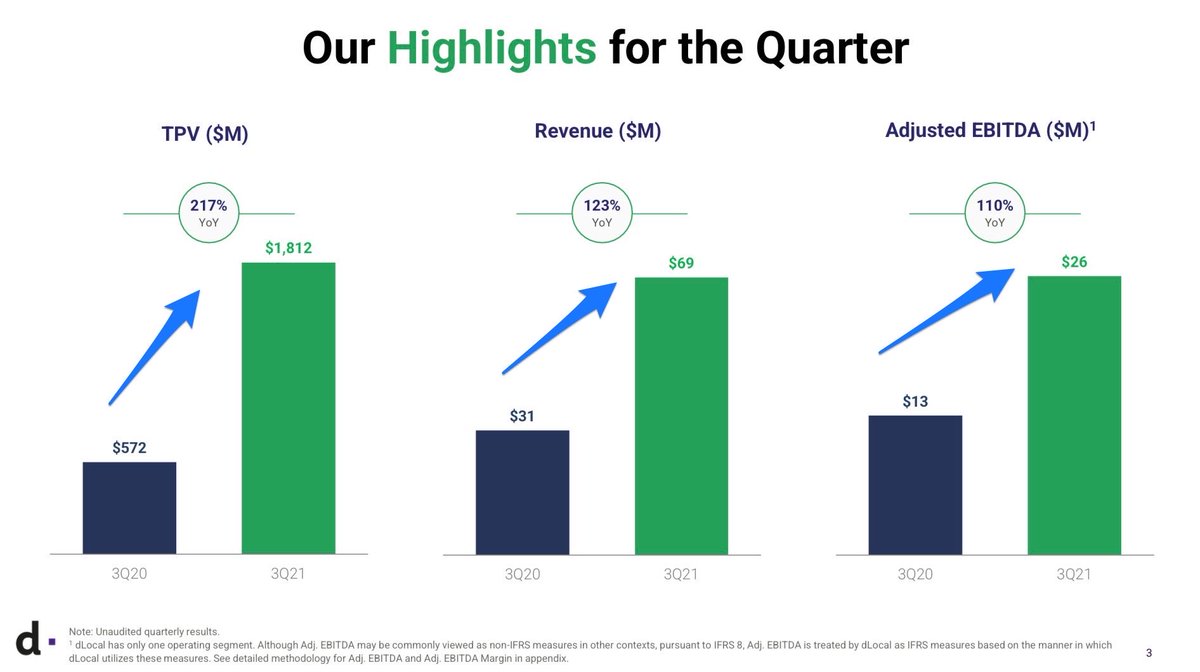
DLocal $DLO 3Q21 Earnings 🚀

- TPV $1.8b +217% 🚀
- TPV ratio/take-rate 3.8% -30bps QoQ ↘️
- Rev $69m +123% 🚀
- Adj EBITDA $26m +110% 🚀 margin 38% ⭐️ -211bps ↘️
- NG Net Income $20m +129% 🚀 margin 29% ⭐️ +89bps ↗️
- High Net Retention 185% ⭐️
1 | Strong Q3

“We continue to see strong growth across multiple verticals as we see local economies continue to bounce back and global merchants prioritize their efforts in emerging markets.”
2 | $DLO solving the problem of EM payments complexity
Read 16 tweets
17 Nov
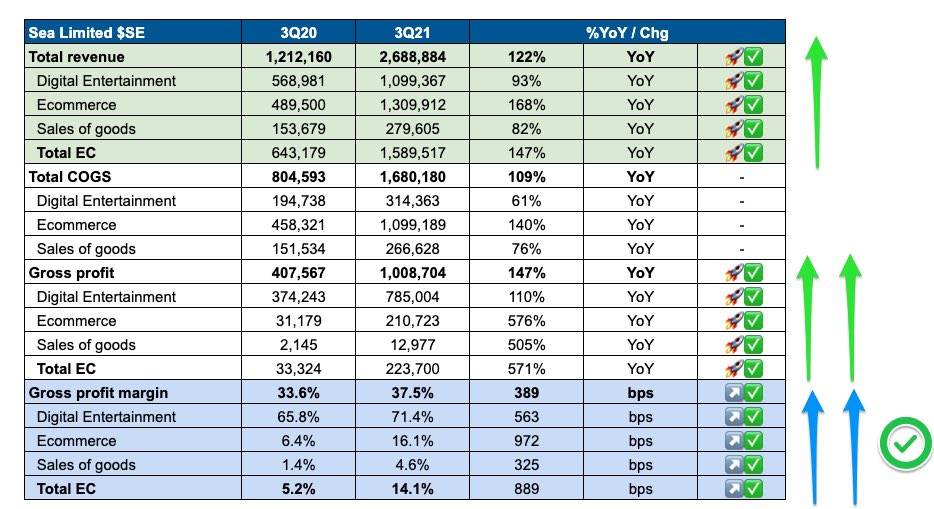
Sea Limited $SE 3Q21 Earnings 🚀

1 | Rapid revenue growth 🚀 and rising Gross Profit Margins ✅, especially in E-commerce
2 | Operating Leverage (declining R&D, S&M & G&A margins) leading to improving profit margins (EBIT & Net Income). ✅

- Note Adj EBITDA & OCF margins were lower this quarter.
3 | Segment Level EBIT Margins Analysis:

Ecommerce 🛒 & Digital Financial Services 💵 is rapidly improving their profitability, though off a highly negative base. ↗️✅
Read 20 tweets
15 Nov
Tencent $TCEHY 3Q21 Earnings

- Rev ¥142b +13% ↗️
- Gross Profit ¥62.8b +11% ↗️ margin 44% -108bps ↘️
- EBITDA ¥49.3b +3% margin 35 % -354bps ↘️
- EBIT ¥40.8b +7% ↗️ margin 29% -171bps ↘️
- Net Income ¥32.5b -2% ↘️ margin 23% -372bps ↘️
- FCF ¥24b -14% ↘️ margin 17% -548bps ↘️
Business Metrics ↗️

- VAS Rev ¥75b +8% ↗️
- Domestic Game Rev ¥34b +5% ↗️
- Int Game Rev ¥11b +20% ↗️⭐️
- Social Network Rev ¥30b +7% ↗️
- Online Ad Rev ¥23b +5% ↗️
- Social Ad ¥19b +7% ↗️
- Media Ad ¥4b -4% ↘️
- FinTech Rev ¥43b +30% ↗️⭐️
Operating Metrics 📶

- MAU (Weixin & WeChat) 1.3b +4% ↗️ +1%QoQ ↗️
- VAS Subs 235m +10% ↗️ +2%QoQ ↗️
- Mobile MAU (QQ) 574m -7% ↘️ -3% QoQ ↘️

⭐️ Invested Shareholdings ¥1,197bn ($185bn) now ~¼ of mkt cap, with $MPNGY, $SE, $PDD, $JD ~60% of that.
Read 12 tweets

Did Thread Reader help you today?

Support us! We are indie developers!


This site is made by just two indie developers on a laptop doing marketing, support and development! Read more about the story.

Become a Premium Member ($3/month or $30/year) and get exclusive features!

Become Premium

Too expensive? Make a small donation by buying us coffee ($5) or help with server cost ($10)

Donate via Paypal

Thank you for your support!

Follow Us on Twitter!

:(