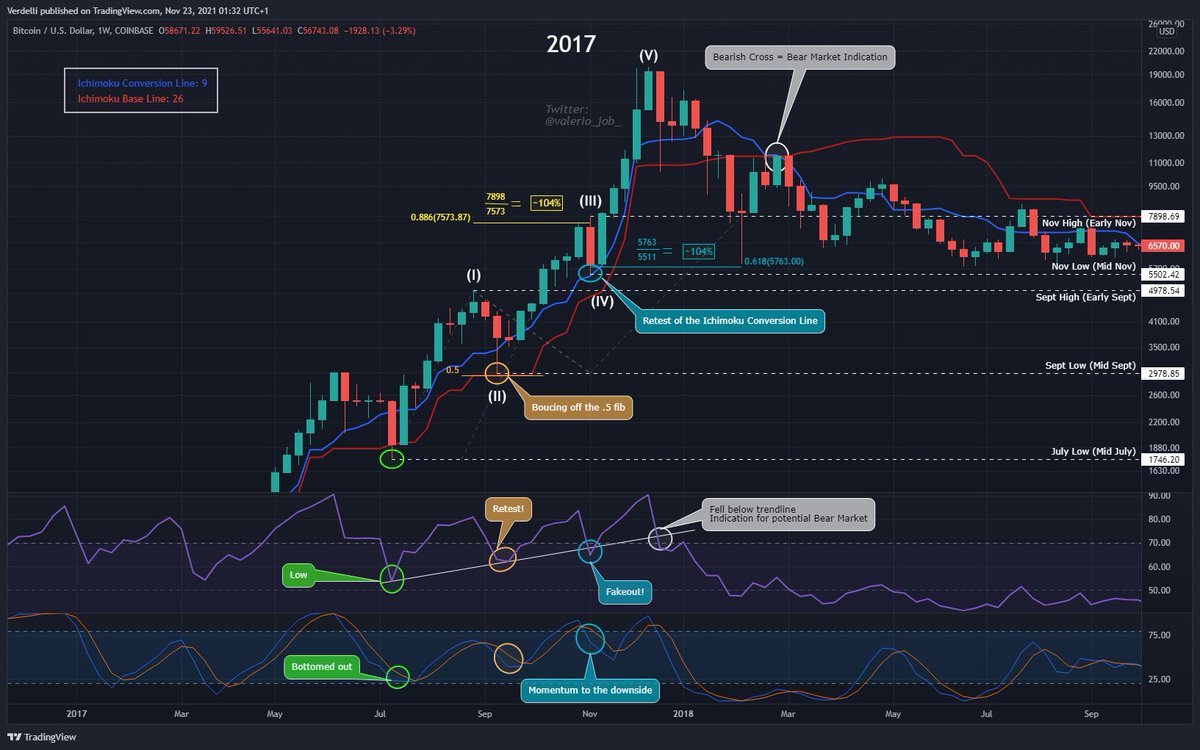
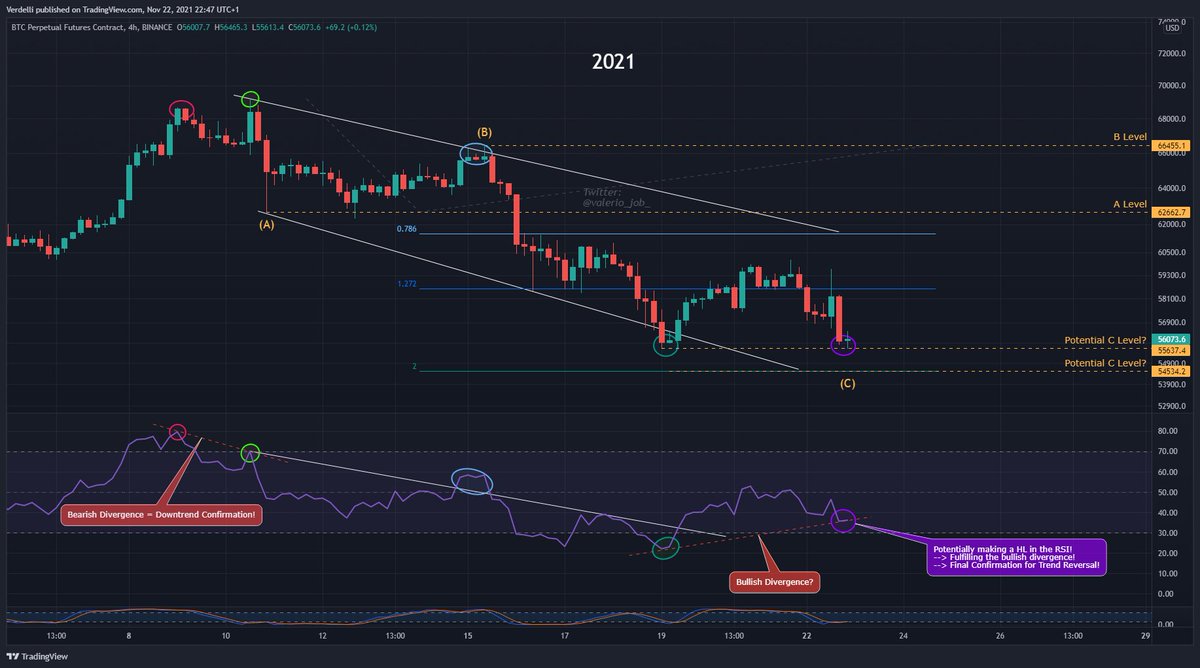
Just compared the bottom from end of sept this year to the current bottom. Went into the lower timeframes and checked all the details. Wouldn't be surprised if we reclaim the 58.5k area, get rejected, and then dip again and retest the the 55-56k and form the triple bottom!
And after we formed the triple bottom the breakout is pretty imminent. But still from today's pov it can still take a few days before pushing heavily to the upside.
There is many reasons for me to make this assumption. But currently I don't have the time to put all my thoughts into a nice clear chart because I need to prepare for some smaller uni exams this week. Just wanted to share this quickly. It is not guaranteed, just an assumption!
Hopefully tomorrow I will be able to share a chart where I explain my thoughts!
• • •
Missing some Tweet in this thread? You can try to
force a refresh
A detailed emotion-based comparison between the post Covid-19 situation and the current one (Nov-21) for #BTC . This Analysis is done in the weekly timeframe for #Bitcoin!
Reading this thread may take a few minutes. But it’ll be well worth it!
You'll understand how emotions influence the majority of the investor’s decision making when trading. 'Cause this leads to same patterns and market structures reoccurring over and over again. This allows us to compare them and take conclusions on how probable they are to reoccur.
This thread will then help you understand: 1) where we currently are 2) where we are probably headed in the next few weeks/months 3) And most importantly it will tell you what exactly you need to look out for to have confirmation on the upcoming expected market behavior!
Went over the weekly tf for #Bitcoin and want to share my thoughts. This thread will definitely help you create your own opinion whether or not the bottom is in!
Dont start reading this thread expecting a clear yes or no. Read it and make up your own mind! Let the facts guide u!
1/ --- Fib Targets ---
The Charts are as always very self-explaining. Will just try to explain here my thoughts as good as possible.
What fascinates me the most is that a top for wave (III) of ~ $69k could have actually been expected.
Why?
1a/
Well first, please have a look at how I counted the 5 Elliot waves. From July on we can find a similar 5-waves structure in 2021 & 2017. The bottom of wave II was in both cycles exactly at the 0.5 fib drawn from wave I bottom to wave I peak.
Why? 'Cause emotions dont change
That is the pullback I was expecting for #Bitcoin !
Playing out well so far! Finally we can start seeing the bullish divergence I was waiting for in the 4hr Chart!🔥
Deleted a lot of details and explanations in the chart as it was way too much information. Feel free to go back to my older thread if you haven't read it yet or want to see the chart explanations again.
As I already said in the prev tweet, price dropping is/was important to fulfill the bullish divergence. We just saw another Low in the PA and a higher Low in the RSI. That is very very key!
The .382fib lvl is a very important area. It has been used as support from Nov 16th to Nov 18th. From Nov 19th on we have been forming and holding this ascending channel very well. We touched the .382fib as resistance already yesterday + earlier today and are nearing it again rn!
Now, what happens next?
Well so far we have seen the golden cross where the 21 EMA crossed above the 55 EMA which is definitely a positive sign that supports a bullish breakout! Also we can clearly see how well the 55 EMA was holding as support during the past 24 hrs.