A detailed emotion-based comparison between the post Covid-19 situation and the current one (Nov-21) for #BTC . This Analysis is done in the weekly timeframe for #Bitcoin!
Reading this thread may take a few minutes. But it’ll be well worth it!
Reading this thread may take a few minutes. But it’ll be well worth it!

You'll understand how emotions influence the majority of the investor’s decision making when trading. 'Cause this leads to same patterns and market structures reoccurring over and over again. This allows us to compare them and take conclusions on how probable they are to reoccur.
This thread will then help you understand:
1) where we currently are
2) where we are probably headed in the next few weeks/months
3) And most importantly it will tell you what exactly you need to look out for to have confirmation on the upcoming expected market behavior!
1) where we currently are
2) where we are probably headed in the next few weeks/months
3) And most importantly it will tell you what exactly you need to look out for to have confirmation on the upcoming expected market behavior!
This is definitely not guaranteed nor is it financial advice in any kind of means!
Table of Contents:
1) General Market Structure
2) TDI
3) RSI
4) StochRSI
5) Supertrend
6) Fib Targets
If you only care about the targets for the end of the bull market, you can skip to Nr. 6
Table of Contents:
1) General Market Structure
2) TDI
3) RSI
4) StochRSI
5) Supertrend
6) Fib Targets
If you only care about the targets for the end of the bull market, you can skip to Nr. 6
1)- -- General Market Structure ---
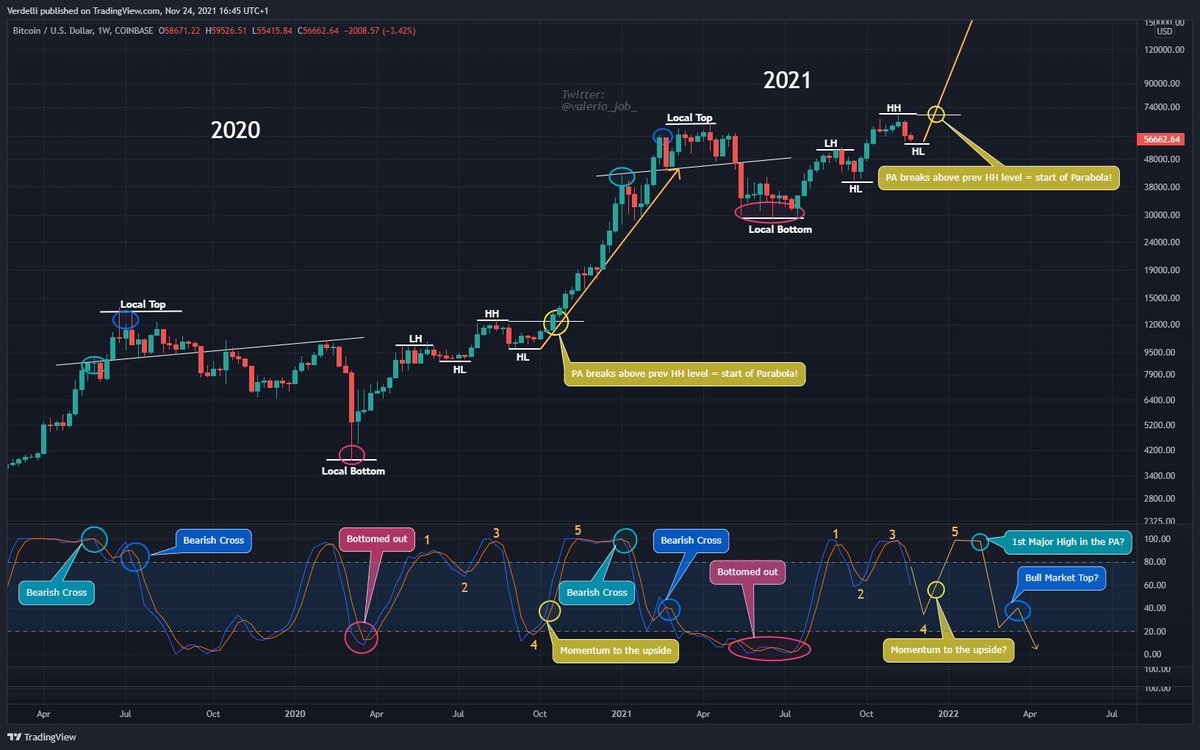
If you believe it or not, there was a very similar market structure back in 2020 compared to this year. Please have a look at my chart. In both fractals we had a local top, followed by a local bottom to then push up again to make a lower High.
If you believe it or not, there was a very similar market structure back in 2020 compared to this year. Please have a look at my chart. In both fractals we had a local top, followed by a local bottom to then push up again to make a lower High.

1a/
We then continued with a lower Low, followed by another higher High and then another lower Low, and that is where we currently are positioned. If you look back in 2020 at what happened after reaching this LL, you can see that we consolidated for a bit before going parabolic!
We then continued with a lower Low, followed by another higher High and then another lower Low, and that is where we currently are positioned. If you look back in 2020 at what happened after reaching this LL, you can see that we consolidated for a bit before going parabolic!

2) --- TDI Indicator ---
Education:
The TDI Indicator is basically a mixed momentum indicator that consists of:
- The Bollinger Band (Upper & Lower Band (blue) and the Middle Band (orange))
- The RSI (green & red)
- The 7-SMA
Education:
The TDI Indicator is basically a mixed momentum indicator that consists of:
- The Bollinger Band (Upper & Lower Band (blue) and the Middle Band (orange))
- The RSI (green & red)
- The 7-SMA

2a/
Please have a look at the chart and find the white trendline. This is a very important trendline that will be key throughout this whole thread!
I don't want to explain the chart too much as it'd take way too long and I put extra effort drawing the chart very self-explaining!
Please have a look at the chart and find the white trendline. This is a very important trendline that will be key throughout this whole thread!
I don't want to explain the chart too much as it'd take way too long and I put extra effort drawing the chart very self-explaining!

2b/
Obviously the same colors indicate the same parts of the two compared fractals.
All I want to add is that I think all these similarities are just astonishing! Please look for yourself!
Obviously the same colors indicate the same parts of the two compared fractals.
All I want to add is that I think all these similarities are just astonishing! Please look for yourself!

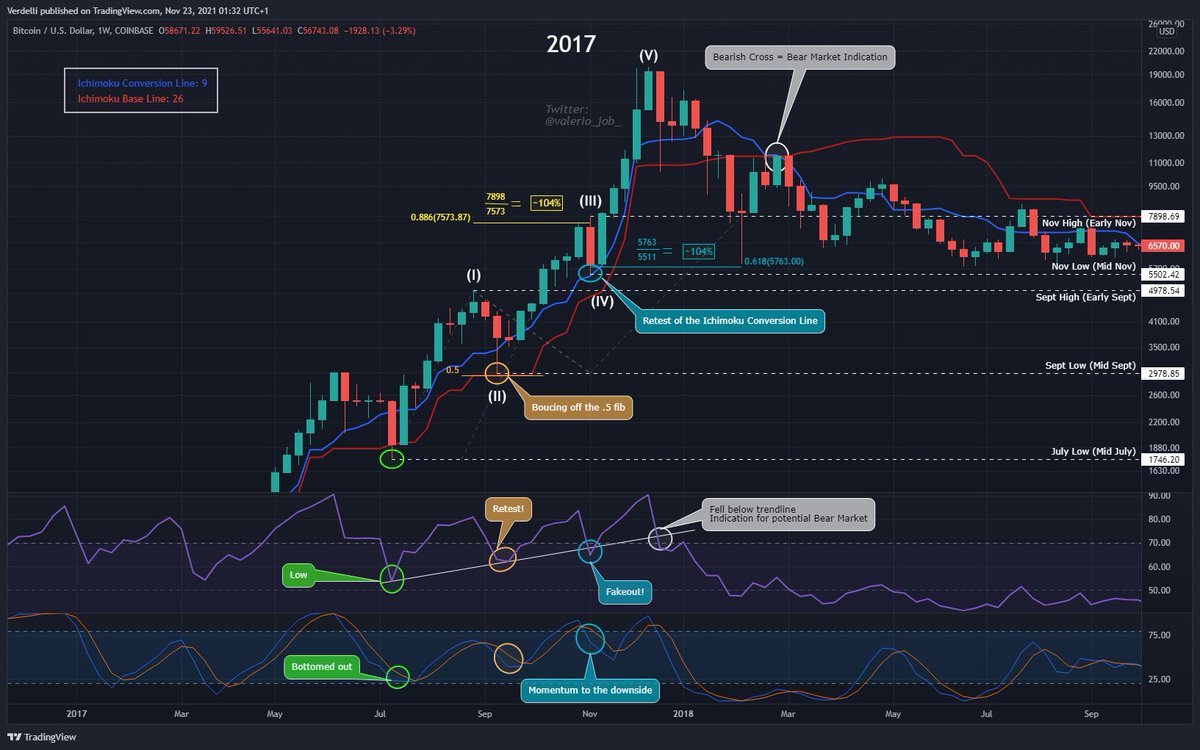
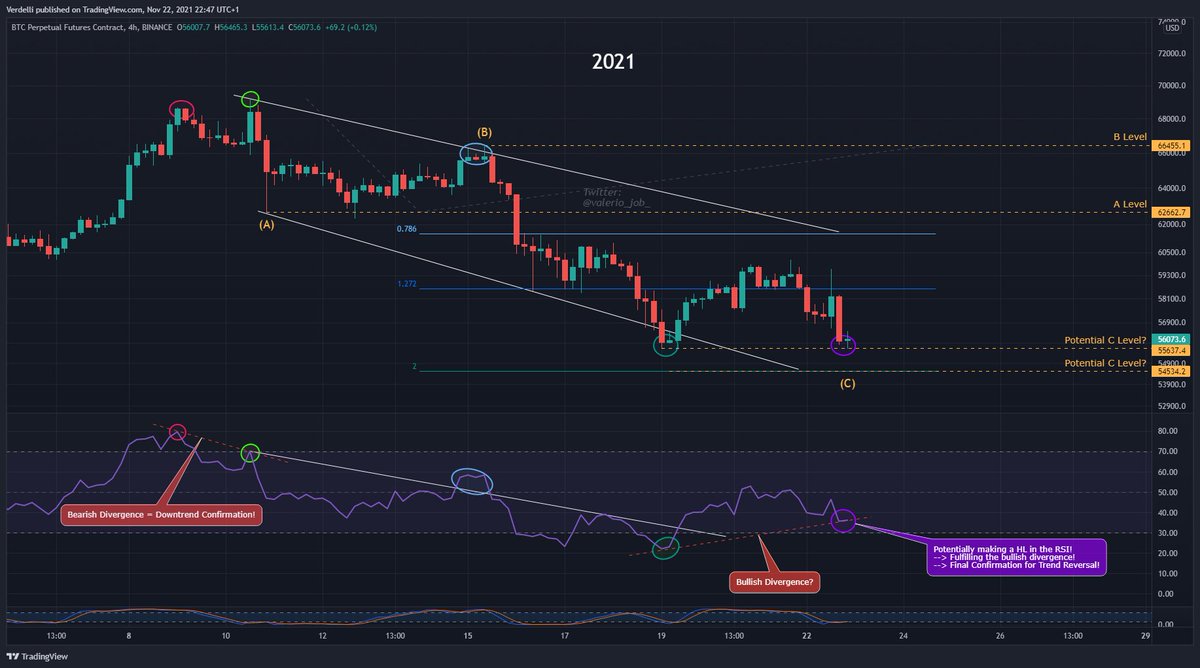
3) --- The RSI ---
Firstly, we can find these beautiful bearish divergences for the two local tops (one in 2019/2020 and one in 2021). Also very important here are the two resistance trendlines in the RSI that occurred in 2020 and where very key to understand what to expect next
Firstly, we can find these beautiful bearish divergences for the two local tops (one in 2019/2020 and one in 2021). Also very important here are the two resistance trendlines in the RSI that occurred in 2020 and where very key to understand what to expect next

3a/
And these exact same trendlines we can find again in the 2021 RSI!
Back in 2020 after making the 2nd HL we still consolidated for some weeks. And the parabolic season only began once we:
1. Flipped the HH-Level in the PA
2. Broke above the 2nd trendline in the RSI
And these exact same trendlines we can find again in the 2021 RSI!
Back in 2020 after making the 2nd HL we still consolidated for some weeks. And the parabolic season only began once we:
1. Flipped the HH-Level in the PA
2. Broke above the 2nd trendline in the RSI

3b/
Now coming back to the current year. Listen closely, while it is NOT guaranteed that there will be a parabolic season coming (even though chances are freaking high), it IS guaranteed that for a parabolic season to come these two indications need to be confirmed first!!
Now coming back to the current year. Listen closely, while it is NOT guaranteed that there will be a parabolic season coming (even though chances are freaking high), it IS guaranteed that for a parabolic season to come these two indications need to be confirmed first!!

4) --- The Stochastic RSI ---
For the StochRSI Analysis I used the SAME important parts (colored circles) as from the RSI Analysis, and compared them. And once again I am truly fascinated by the accuracy of the similarities!
Just have a look for yourself..
For the StochRSI Analysis I used the SAME important parts (colored circles) as from the RSI Analysis, and compared them. And once again I am truly fascinated by the accuracy of the similarities!
Just have a look for yourself..

4a/
I also drew a potential future path of how I think the StochRSI might play out! What is important though is that I think in order to flip the HH-Level, and start the Parabola, we need the momentum of the W StochRSI on our side! which we currently dont have! (Same as 2020!)
I also drew a potential future path of how I think the StochRSI might play out! What is important though is that I think in order to flip the HH-Level, and start the Parabola, we need the momentum of the W StochRSI on our side! which we currently dont have! (Same as 2020!)

4b/
It can still take up to a few weeks before seeing this momentum change BUT on the other hand it doesn't have to take that long. Because we dont necessarily need to drop into the cellar to change momentum. We can already change halfway through (see how I drew the future path).
It can still take up to a few weeks before seeing this momentum change BUT on the other hand it doesn't have to take that long. Because we dont necessarily need to drop into the cellar to change momentum. We can already change halfway through (see how I drew the future path).
5) --- Supertrend ---
Education:
The Supertrend indicates whether you're currently in a uptrend or downtrend. It changes the trend once you close below the support or above the resistance! Especially in HTF it can tell you very well whether we're still in a Bull Market or not!
Education:
The Supertrend indicates whether you're currently in a uptrend or downtrend. It changes the trend once you close below the support or above the resistance! Especially in HTF it can tell you very well whether we're still in a Bull Market or not!

5a/
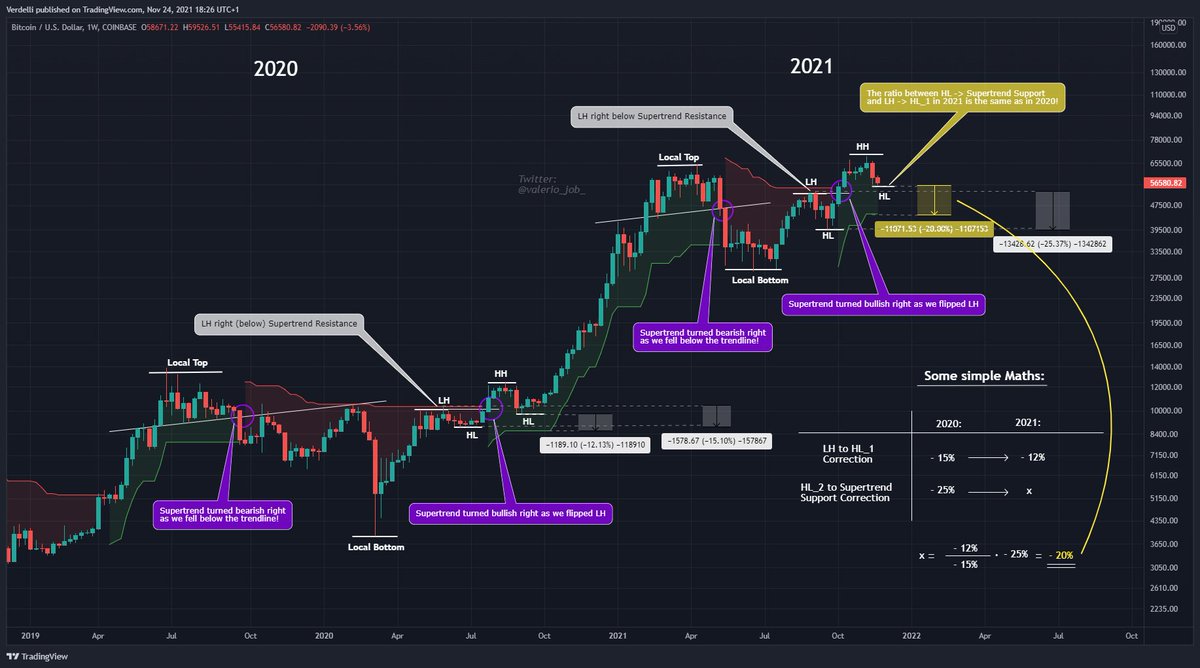
Forget the math part for now. Currently it indicates us that we're still in the green area (uptrend). This means that we're NOT in a bear market yet! Now we get back to this trendline I told you to keep in mind.
Forget the math part for now. Currently it indicates us that we're still in the green area (uptrend). This means that we're NOT in a bear market yet! Now we get back to this trendline I told you to keep in mind.

5b/
As you can see in both fractals (2020 & 2021), before reaching the local top we were in a uptrend. But once we lost support and fell below the trendline the indicator started showing downtrend signals! Some weeks later we flipped the LH-Level and the indicator turned green!
As you can see in both fractals (2020 & 2021), before reaching the local top we were in a uptrend. But once we lost support and fell below the trendline the indicator started showing downtrend signals! Some weeks later we flipped the LH-Level and the indicator turned green!

5c/
Now let's see if this indicator can actually tell us if the current bottom might be in or not..
Here is where we start using some math formulas but trust me it's very simple! We calculate the ratio between the 1st pullback in 2020 and the % distance between HL_2 to Support.
Now let's see if this indicator can actually tell us if the current bottom might be in or not..
Here is where we start using some math formulas but trust me it's very simple! We calculate the ratio between the 1st pullback in 2020 and the % distance between HL_2 to Support.

5d/
We do that by dividing the percentage of the 1st pullback (LH to HL_1) by the percentage of the distance between HL_2 to the support of the Supertrend indicator. Now we use this ratio and multiply it with the % of the 1st pullback in 2021 (from LH to HL_1) and we get ~ 20%.
We do that by dividing the percentage of the 1st pullback (LH to HL_1) by the percentage of the distance between HL_2 to the support of the Supertrend indicator. Now we use this ratio and multiply it with the % of the 1st pullback in 2021 (from LH to HL_1) and we get ~ 20%.
5e/
So this "20%" is the distance (in %) between the 2nd HL in 2021 to the Supertrend support right below this HL_2. And if this formula and method was to be true then we should not dip that much further from here ($55k) and bottom is most likely in!
So this "20%" is the distance (in %) between the 2nd HL in 2021 to the Supertrend support right below this HL_2. And if this formula and method was to be true then we should not dip that much further from here ($55k) and bottom is most likely in!

6) --- Fib targets ---
Now you probably think to yourself now "Enough with these boring comparisons, we understood that it is very similar. Can we finally calculate the price targets?!"
And I say "I got you buddy. Grab a cup of coffee and let me show you!"
Now you probably think to yourself now "Enough with these boring comparisons, we understood that it is very similar. Can we finally calculate the price targets?!"
And I say "I got you buddy. Grab a cup of coffee and let me show you!"

6a/
The fibs that called the local top in April 2021, based on the market construct from 2020, were the 2.414 & the 2.618 fib. To be exact, the top was in the area between these two fibs. Using the same fibs but drawn from the current construct of 2021, gives us a target of .. :)
The fibs that called the local top in April 2021, based on the market construct from 2020, were the 2.414 & the 2.618 fib. To be exact, the top was in the area between these two fibs. Using the same fibs but drawn from the current construct of 2021, gives us a target of .. :)

6b/
Exactly, they'd give us a price range of ~ $200k to $245k as a pot target! Now what about the timing? Even though I don't like to give date predictions we can still see a beautiful similarity which we can take to our advantage to come up with some potential date targets!
Exactly, they'd give us a price range of ~ $200k to $245k as a pot target! Now what about the timing? Even though I don't like to give date predictions we can still see a beautiful similarity which we can take to our advantage to come up with some potential date targets!

6c/
The increase from local bottom to LH in 2020 has the same angle as the one from 2021. So we can assume the 2nd increase from HL_2 to the top also remains the same. This gives us a date range of mid Feb-22 to mid Mar-22 as a potential target for the top of this bull market!
The increase from local bottom to LH in 2020 has the same angle as the one from 2021. So we can assume the 2nd increase from HL_2 to the top also remains the same. This gives us a date range of mid Feb-22 to mid Mar-22 as a potential target for the top of this bull market!

7) --- Rounding Off ---
To round off I wanna start by giving a big shoutout to @clevercrypto7 as I saw him comparing these two fractals in his latest BTC analysis yesterday. This idea really got me so fascinated that I decided to dig into it a bit deeper and do a TA on it.
To round off I wanna start by giving a big shoutout to @clevercrypto7 as I saw him comparing these two fractals in his latest BTC analysis yesterday. This idea really got me so fascinated that I decided to dig into it a bit deeper and do a TA on it.
Also I want so say a big thank you from the bottom of my heart for all the crazy support I'm getting from this amazing community! Last Thursday I had 2.5k followers and now not even a week later I'm already at 8.5k!
I have to say 10k would really look cool I guess xd🤷♂️
I have to say 10k would really look cool I guess xd🤷♂️
Jokes aside, I started committing myself to Twitter around a month ago. And it's crazy where I am at now after only 1 month! I really appreciate the support from every single one of you! Thank You Guys!🙏🧡
Congrats if you read all the way to the end of this thread! You just made your future self a BIIG favor! Trust me, there are for sure many people that thought they're not wasting their time reading such a long thread...
Anyway I hope you enjoyed it!
Let's go champs!👊🚀
Anyway I hope you enjoyed it!
Let's go champs!👊🚀
• • •
Missing some Tweet in this thread? You can try to
force a refresh