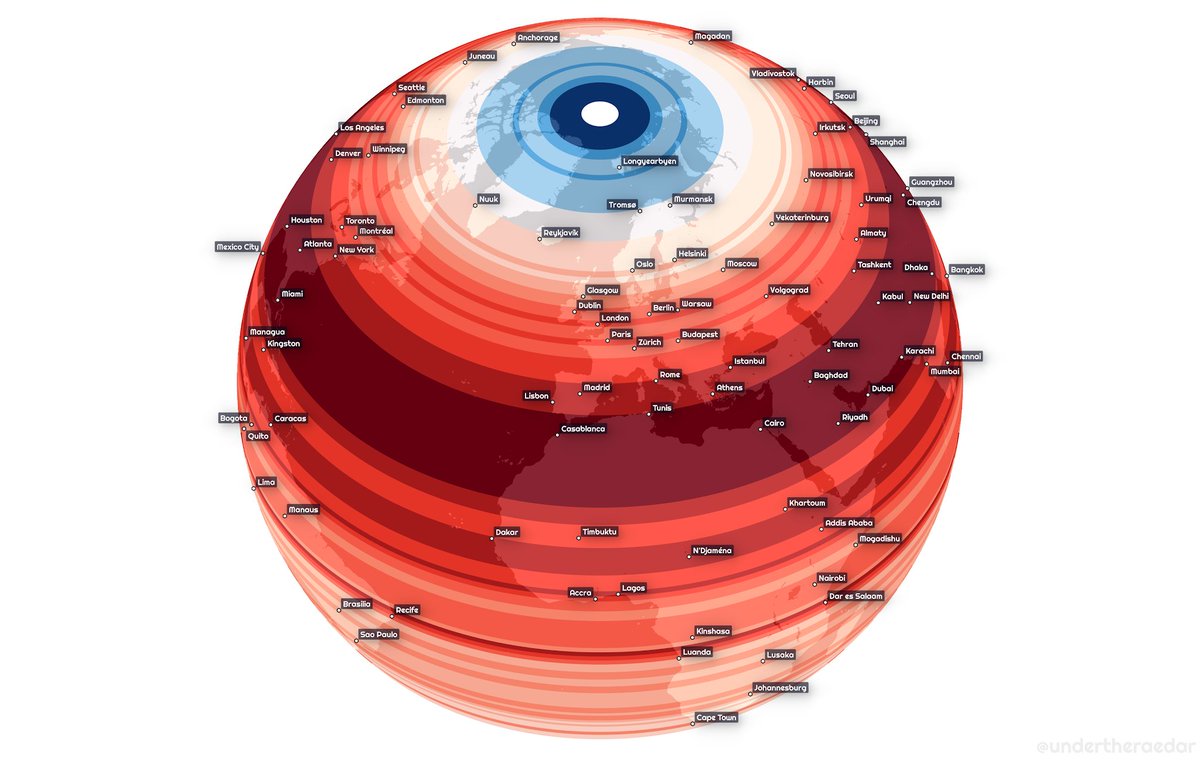
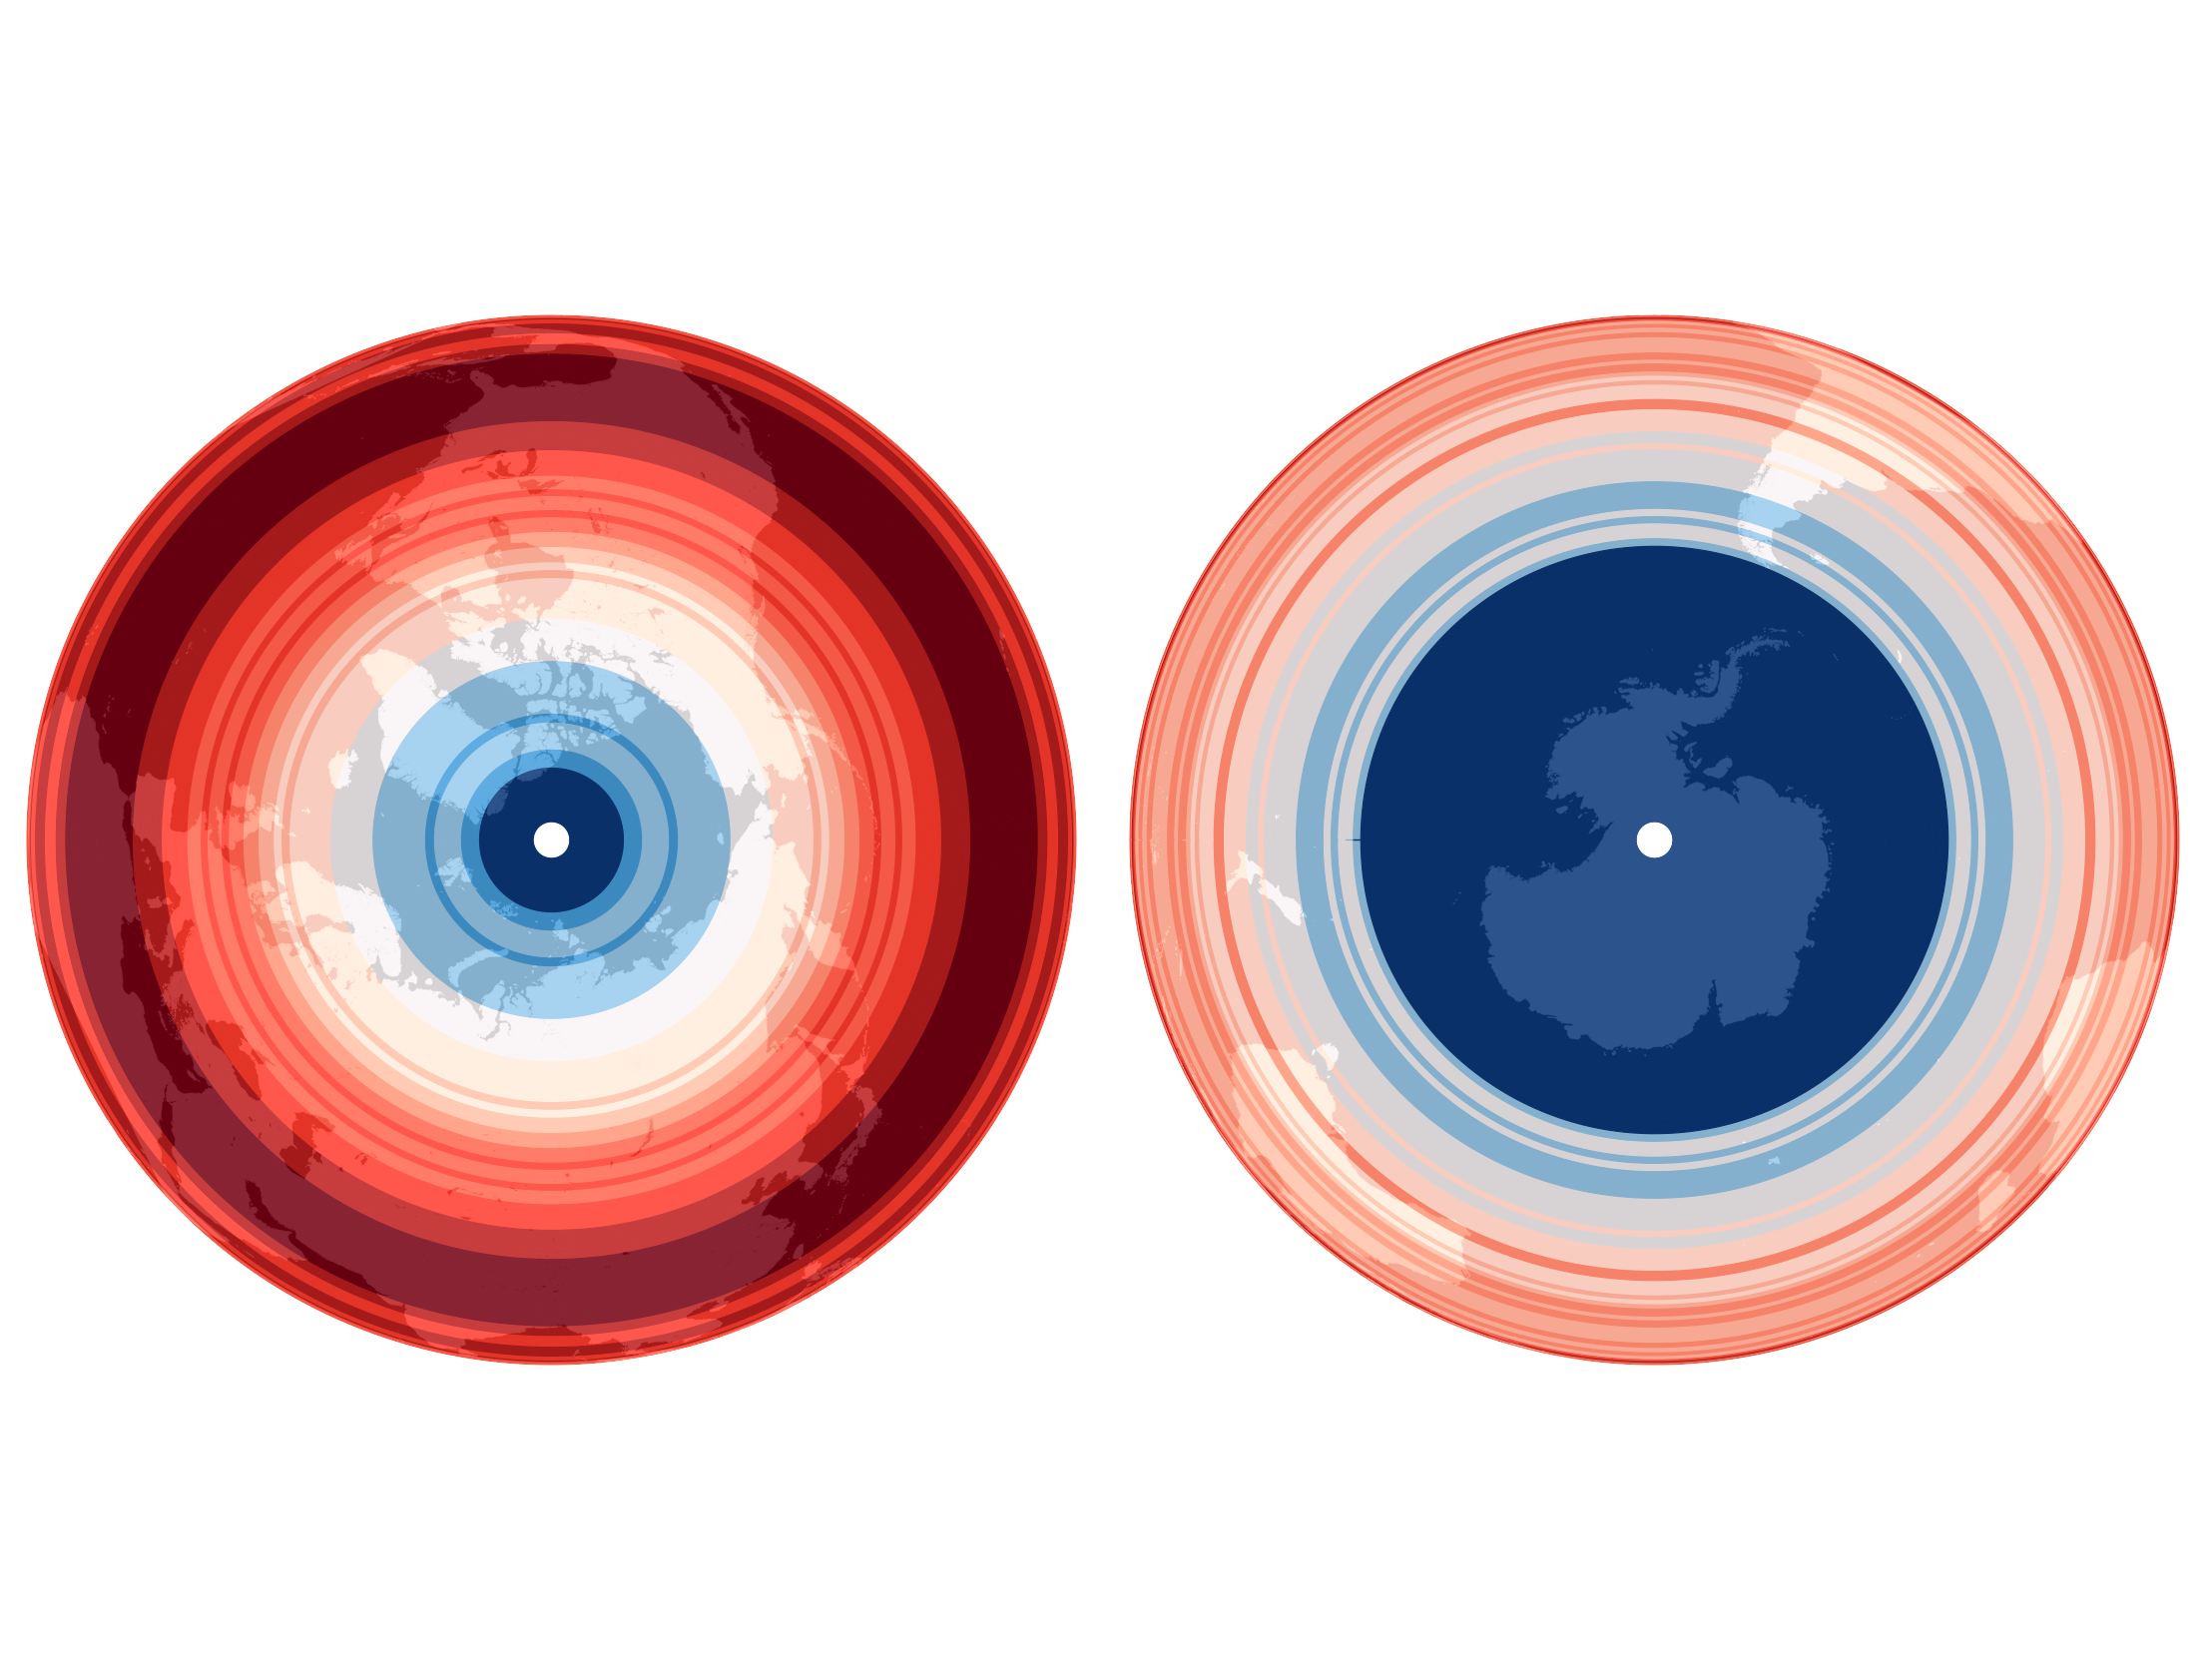
Weird alien eyeball? Or world population by latitude? Just another map experiment but since it fits with today's #30DayMapChallenge theme I'll share it here

statsmapsnpix.com/2021/11/world-…
I included a population vs land by latitude gif too, because it seems people don't like to live in the sea
does it matter if you use WorldPop instead of GHSL? Not that much, but WorldPop has a 2020 version so I used that
population by single degree is on the left of the big image - and would you believe it
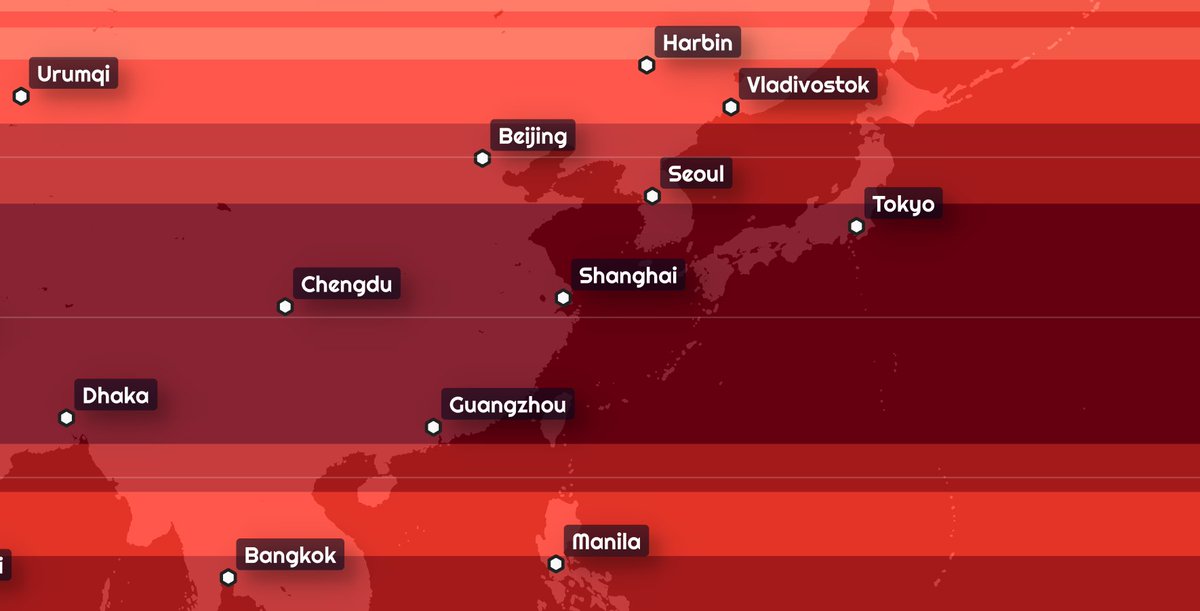
or maybe density by latitude (based on pop/land) makes more sense eh
and when you look from directly above or below, you risk making a weird eyeball projection, but that's a risk I was willing to take
there's more on the blog for people who need to know this kind of stuff (and of course you'll see Bill Rankin's name there too)

statsmapsnpix.com/2021/11/world-…
you can find the high-res 600dpi file here for the world, makes it easier to read the population totals

Flat image - automaticknowledge.org/images/wpop-WI…

Globe - automaticknowledge.org/images/globe-v…

From above and below - automaticknowledge.org/images/eyeball…
plus there are all sorts of other odds and ends in that /images folder!
PS for any font nerds out there, it's Righteous
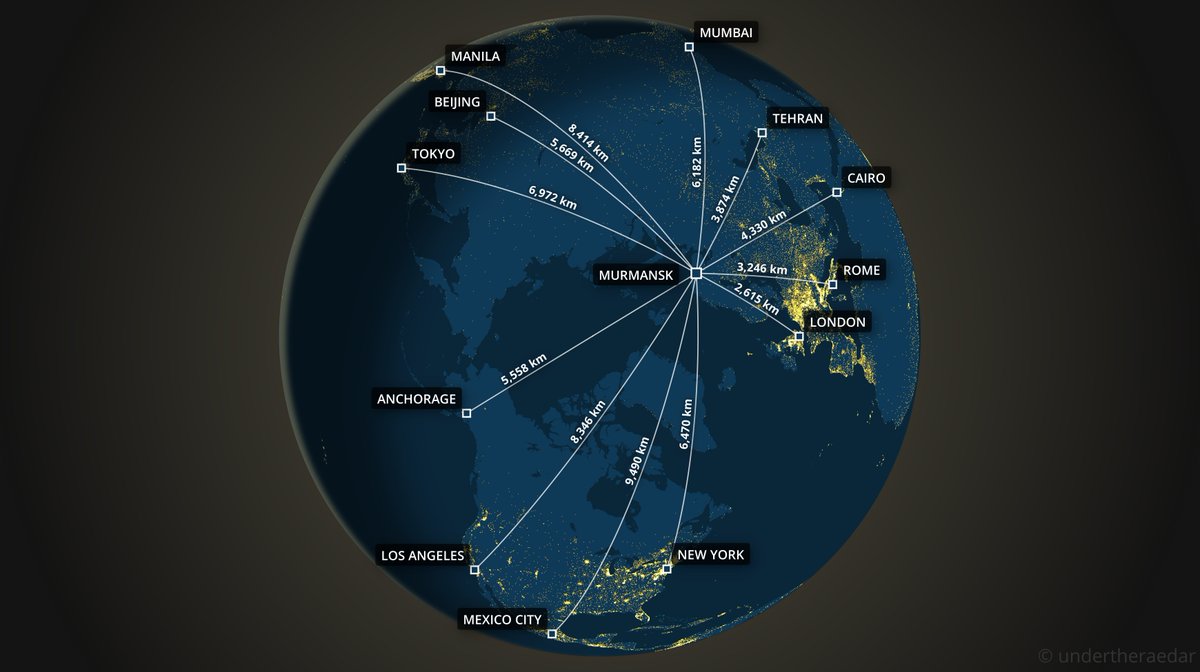
☝️ these are mainly playthings, but the methods behind them have their uses, including figuring out how far away everywhere is from Murmansk, and many more real-world applications

• • •

Missing some Tweet in this thread? You can try to force a refresh
 

Keep Current with Alasdair Rae

Alasdair Rae Profile picture

Stay in touch and get notified when new unrolls are available from this author!

Read all threads

This Thread may be Removed Anytime!

PDF

Twitter may remove this content at anytime! Save it as PDF for later use!

Try unrolling a thread yourself!

how to unroll video
  1. Follow @ThreadReaderApp to mention us!

  2. From a Twitter thread mention us with a keyword "unroll"
@threadreaderapp unroll

Practice here first or read more on our help page!

More from @undertheraedar

27 Nov
If you have snow photos you must post snow photos ImageImageImageImage
it won't last long and neither will my fingers if they remain ungloved ImageImageImage
things are getting out of hand ImageImageImage
Read 4 tweets
14 Nov
Just catching up on the latest in functional economic geography news

"A boundary commission should propose adjustments that reflect economic reality." 🥳
already imagining some new shapes
although my preference would be to add a fuzzy 'maybe zone' to the edge of these kinds of maps to reflect the reality of commuter reality
Read 6 tweets
7 Nov
Filed under:

'random Canadian-Scottish geography questions you can answer quickly while having your breakfast at the weekend'

- I may also have calculated the Scottish-Latitude population of Canada while I was at it, surprisingly low Image
plus, not everyone knows that the northern bits of Shetland are further north than the southern tip of Greenland - and even when you hear this you are duty-bound to check it yourself on Google maps because it sounds made up ImageImage
the answer to my vital question, thanks to some 10km gridded data, is that a little over 570,000 people would appear to live at Scottish latitudes in Canada, and I think we can all sleep easy now

open.canada.ca/data/en/datase…
Read 13 tweets
21 Apr
A short city population/datanerdfest coming up in this thread, beginning with a little panoramic tour of the Tokyo metro area - city as far as the eye can see

(I made this using Google Earth Studio btw, a very useful tool)
background: I have been using/playing with/analysing global city population data quite a bit over the years, most recently in an academic paper on the topic with @CJHoole and @stehincks

open access version: eprints.whiterose.ac.uk/149455/3/Conto… Image
we looked at population density for the whole world, using 1km resolution data from the EU's GHSL project - e.g. here's a little snapshot of how it looks across part of West Africa, from our paper Image
Read 14 tweets
28 Nov 20
Here's the final version of the global population density graphic I made, because another one that is circulating was less well defined, and someone cropped NZ off it
this is the little 'About this print' sheet that goes along with it
and, should you have a burning question like 'how can I make one of these?' or 'where do I get the data?' then see my blog for all the answers

statsmapsnpix.com/2020/11/how-to…
Read 8 tweets
26 Nov 20
Possibly of use for UK boffins, data journalists and the like: our (beta) version of a single UK local authority file with insets included (+ all area codes) - join data once, turn insets on/off as required

github.com/alasdairrae/in…

(other files here - automaticknowledge.co.uk/resources/) Image
the bounding boxes are included as well, in a separate file

If you just wanted main map + an inset for London, you could filter layer like this:

"inset_area" IN ('Greater London','None')
you get an inset, you get an inset, everyone gets an inset - except they don't - we may do a version 2 at some point with (e.g. South Wales, Teesside) but for now this is inset in stone
Read 5 tweets

Did Thread Reader help you today?

Support us! We are indie developers!


This site is made by just two indie developers on a laptop doing marketing, support and development! Read more about the story.

Become a Premium Member ($3/month or $30/year) and get exclusive features!

Become Premium

Too expensive? Make a small donation by buying us coffee ($5) or help with server cost ($10)

Donate via Paypal

Thank you for your support!

Follow Us on Twitter!

:(