Happy #JobsDay. Hope you’re staying healthy. #HappyHanukkah.
At 8:30 am ET @BLS_gov delivers the most-important signals abt how economy is changing.
Forecasts’ center:
+573K jobs
4.5% unemployment rate, down 0.1 percentage point (pp)
At 8:30 am ET @BLS_gov delivers the most-important signals abt how economy is changing.
Forecasts’ center:
+573K jobs
4.5% unemployment rate, down 0.1 percentage point (pp)
Americans have gained more income & enjoy higher levels of wealth than ever before.
We want to buy. Consumer and labor demand is high.
We want to buy. Consumer and labor demand is high.
https://twitter.com/aaronsojourner/status/1466513107417804802
Biggest question in the economy: how quickly can we raise supply? Bring more labor & capital to production & boost productivity.
Success means more consumption & lower prices. COVID health risks at home & abroad remain the big obstacle, making work riskier.
Success means more consumption & lower prices. COVID health risks at home & abroad remain the big obstacle, making work riskier.
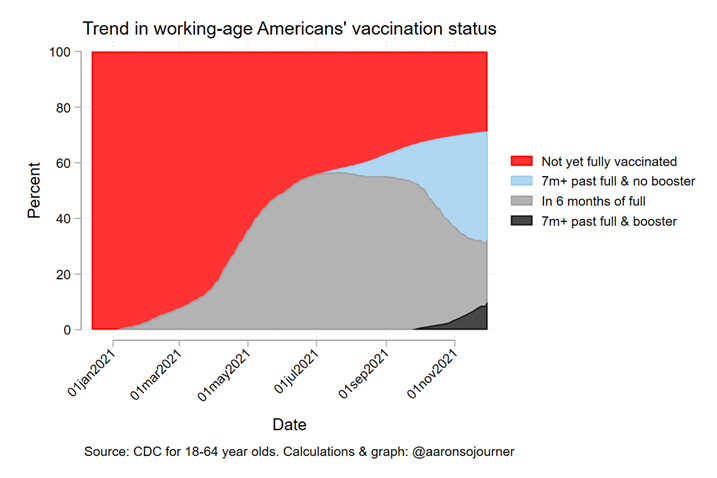
CDC recommends COVID vaccination for working-age Americans + booster if 7+ months past getting fully vaccinated. How's that going?
Roughly a third in each group:
- not yet fully vaccinated,
- need booster, &
- following recommendation.
#Vax. #Boost. #MaskUp. #VirusVsUs.
Roughly a third in each group:
- not yet fully vaccinated,
- need booster, &
- following recommendation.
#Vax. #Boost. #MaskUp. #VirusVsUs.

210K jobs gained last month (mid-Oct to mid-Nov).
Upward revisions continue, with +82K jobs in revisions of prior 2 months.
Any single month's estimate is noisy.
Upward revisions continue, with +82K jobs in revisions of prior 2 months.
Any single month's estimate is noisy.
The pandemic wiped out 10 years of jobs gains in 2 months, putting us back to the bottom of the Great Recession. Growth in mid-2020, stall in late-2020, recovery through 2021.
Still 3.9 million below the pre-pandemic level.
Still 3.9 million below the pre-pandemic level.

Economy added 5.8 million jobs over 12 months to Nov 2021, much stronger growth than any recent year. 

Unemployment rate took a big step down, 0.4 pp to 4.2 percent.
And that happened in the context of ...
And that happened in the context of ...

The labor force participation rate edged up 0.2 pp to 61.8%.
The employment-to-population ratio (EPOP) jumped 0.4 pp to 59.2%
These come from survey of households (HH), whereas jobs # comes from biz survey. Don't always agree. Noise in any month but very good news here.
The employment-to-population ratio (EPOP) jumped 0.4 pp to 59.2%
These come from survey of households (HH), whereas jobs # comes from biz survey. Don't always agree. Noise in any month but very good news here.

The share of prime age (25-54 years old) Americans employed provides an important measure of core labor market strength, omitting people on the fringes of work.
It took an even bigger jump, +0.5 pp to 78.8%.
It took an even bigger jump, +0.5 pp to 78.8%.

Every education group remains below Feb 2020 employment shares, especially Americans with less formal education. 

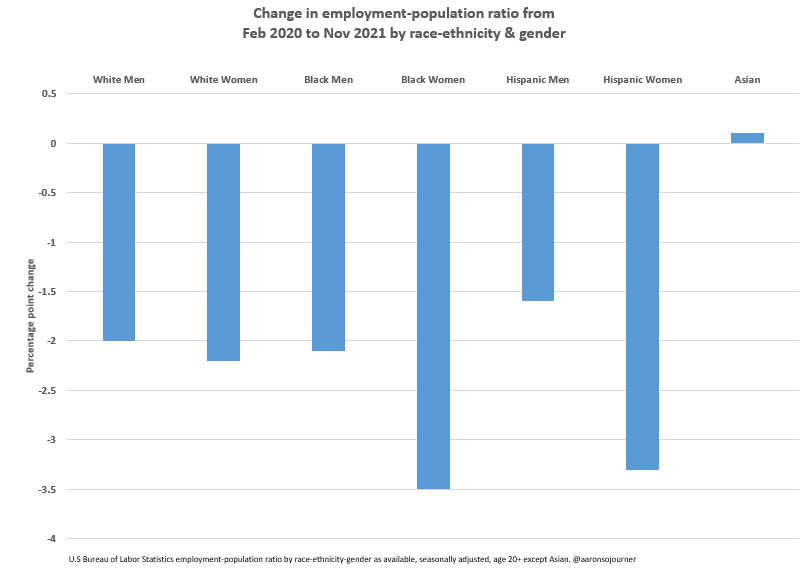
For the first time, a slightly higher share of Asian Americans are employed now than in Feb 2020.
Employment rates for Black and Hispanic women remains the furthest off their pre-pandemic levels.
Employment rates for Black and Hispanic women remains the furthest off their pre-pandemic levels.

That’s the extensive quantity (Q) margin. Intensive Q margin = average hours.
Average workweek hours for private sector ticks up 0.1 to 34.8 hours
Instead of adding staff, employers working staff longer hours.
Part of how US producing pre-pandemic output with fewer jobs.
Average workweek hours for private sector ticks up 0.1 to 34.8 hours
Instead of adding staff, employers working staff longer hours.
Part of how US producing pre-pandemic output with fewer jobs.

Americans stuck in part time but prefer full time = 4.29 million, down a bit this month, basically at pre-pandemic levels. 

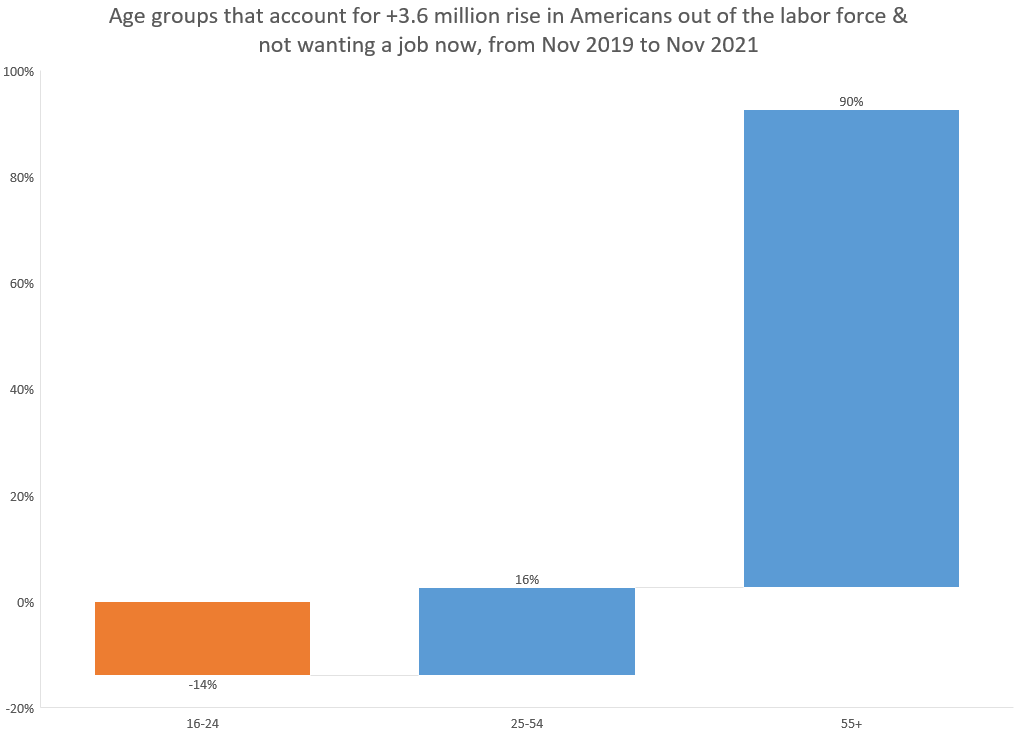
3.6 million more Americans are out of the labor force & say they don't want a job compared to 2 years ago.
Fewer young people are in that category.
Older Americans (55+) account for 90% of rise. Baby Boomers accelerated their retirements. Some will come back, but only some.
Fewer young people are in that category.
Older Americans (55+) account for 90% of rise. Baby Boomers accelerated their retirements. Some will come back, but only some.

BLS estimates 4.7 million fewer Americans employed than pre-pandemic, so this movement of Boomers accounts for most of that.
Today's report includes data only through mid-November, pre-Omicron. How relevant is it for today?
At least for the labor market, there's no evidence at this point of rising layoffs in real-time data.
At least for the labor market, there's no evidence at this point of rising layoffs in real-time data.
https://twitter.com/aaronsojourner/status/1466757936148066304
In sum,
- continued labor market improvement. Signals of great strengthening in unemployment, EPOP & LFPR estimates but of less strengthening in payrolls.
- most important issue: how to increase supply to meet demand? Improve public health & job quality (faster!).
- continued labor market improvement. Signals of great strengthening in unemployment, EPOP & LFPR estimates but of less strengthening in payrolls.
- most important issue: how to increase supply to meet demand? Improve public health & job quality (faster!).
Last thing. @BLS_gov does amazing work to create timely, accurate info about America's working families, a huge public good.
They are there for us & we need to show up for them.
If you are a labor economist or care about workers & employment, follow & join @Friends_of_BLS.
They are there for us & we need to show up for them.
If you are a labor economist or care about workers & employment, follow & join @Friends_of_BLS.
A good way to think about how to reconcile the mixed signals between sources and over time.
https://twitter.com/bencasselman/status/1466775461212663810?s=20
• • •
Missing some Tweet in this thread? You can try to
force a refresh


