Another nugget for you.
If you have identified a set of 100 or let's say 500 instruments to review...
Unless you make it a habit to review them each day around the same time, you will miss opportunities and lack the visual training as patterns develop.
If you have identified a set of 100 or let's say 500 instruments to review...
Unless you make it a habit to review them each day around the same time, you will miss opportunities and lack the visual training as patterns develop.
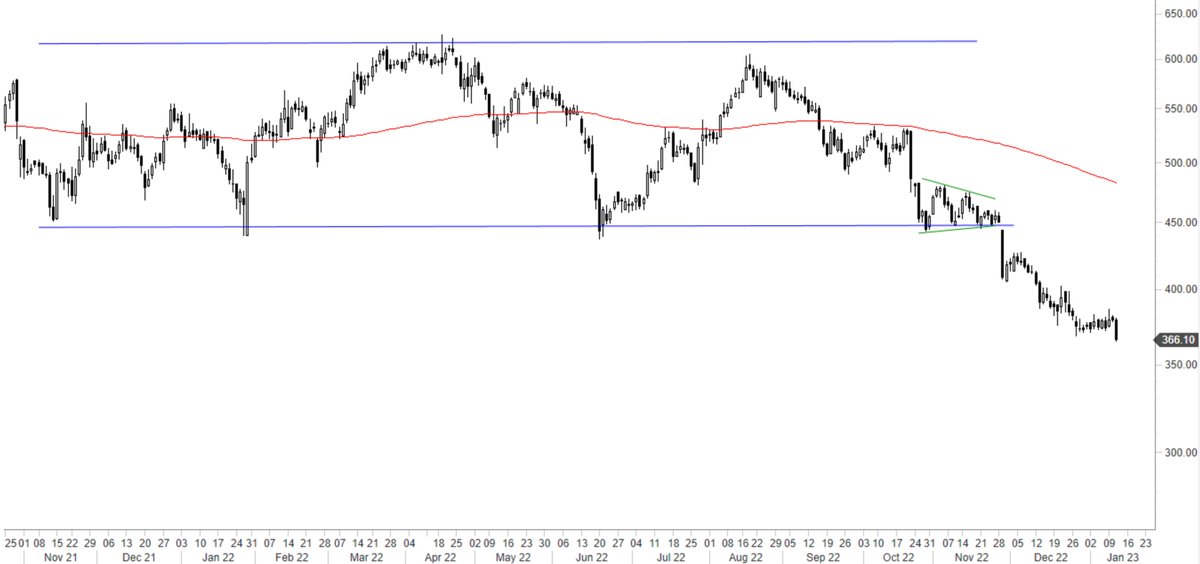
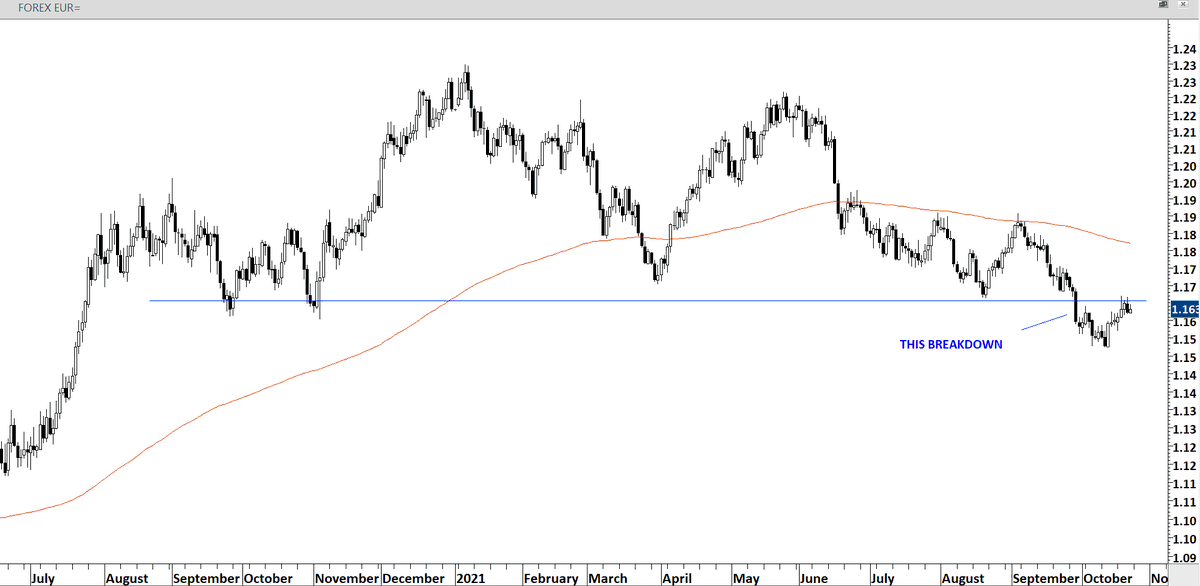
1 year of data loaded on daily scale chart. We look at the right side of the chart to find horizontal setup with several tests of pattern boundary.
Do you now see what we are looking for?
Do you now see what we are looking for?

I doubt anyone who is going through their chart studies on a daily basis with the same template diligently will miss this setup. 

• • •
Missing some Tweet in this thread? You can try to
force a refresh


