Having another go at plotting UK omicron cases (previous attempt plotted total over time, which I decided wasn't very useful). Numbers are still sufficiently small to mean that noise in the data makes a big difference. But based on data so far, current doubling rate is 1-2 days. Image
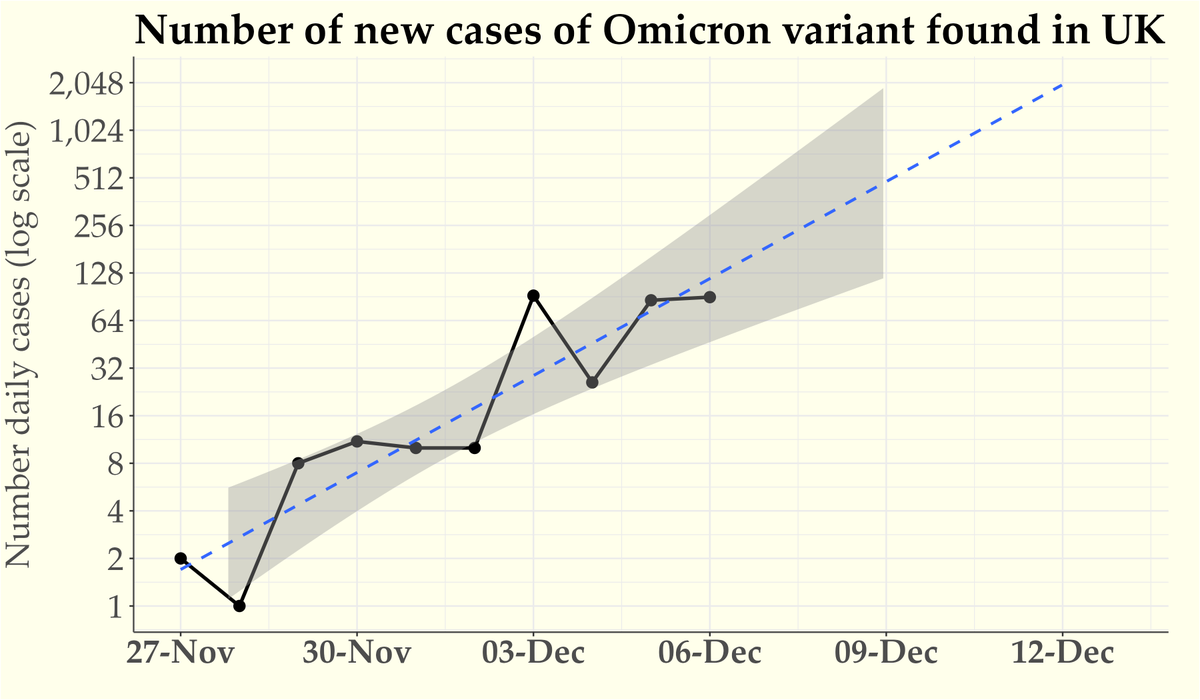
This estimate could be too fast, if we've got better at detecting omicron over the last few days. Or it could be too conservative if it's getting harder for us to track omicron caes as numbers increase. Mix of imported and home-grown cases also unclear. So some caution required.
Updating this graph for 7th Dec. That line of best fit is still consistent with a doubling rate of 1-2 days (midpoint is 1.6 days). Things should get clearer in a couple more days. But we don't need to wait until then to introduce precautionary measures such as working from home. Image
There are additional data in the plot below, from a source with access to SGTF sample data. Alastair suggests a doubling rate of 3 days, but it looks closer to 2 days to me.
Here's an updated plot for 8th Dec. A doubling rate of about 2 days is looking more likely (data so far give a current estimate of 1.65 days, which has slowed slightly). Omicron would need to be a lot milder than delta for this not to be a big problem. Image
Interesting to compare the UK data with that reported in Denmark. Looks very similar. Seems likely that the numbers for 6 Dec reflect a lag and may be revised upward. Without that point, the doubling rate is 1.64 days (about the same as current UK estimate in the above tweet). Image
A bit more mathematical sophistication here, using the larger SGTF data set. Once again suggests a doubling rate of a little under 2 days (although the thread goes on to consider possibility of ascertainment biases which could raise it to ... 2.5 days).
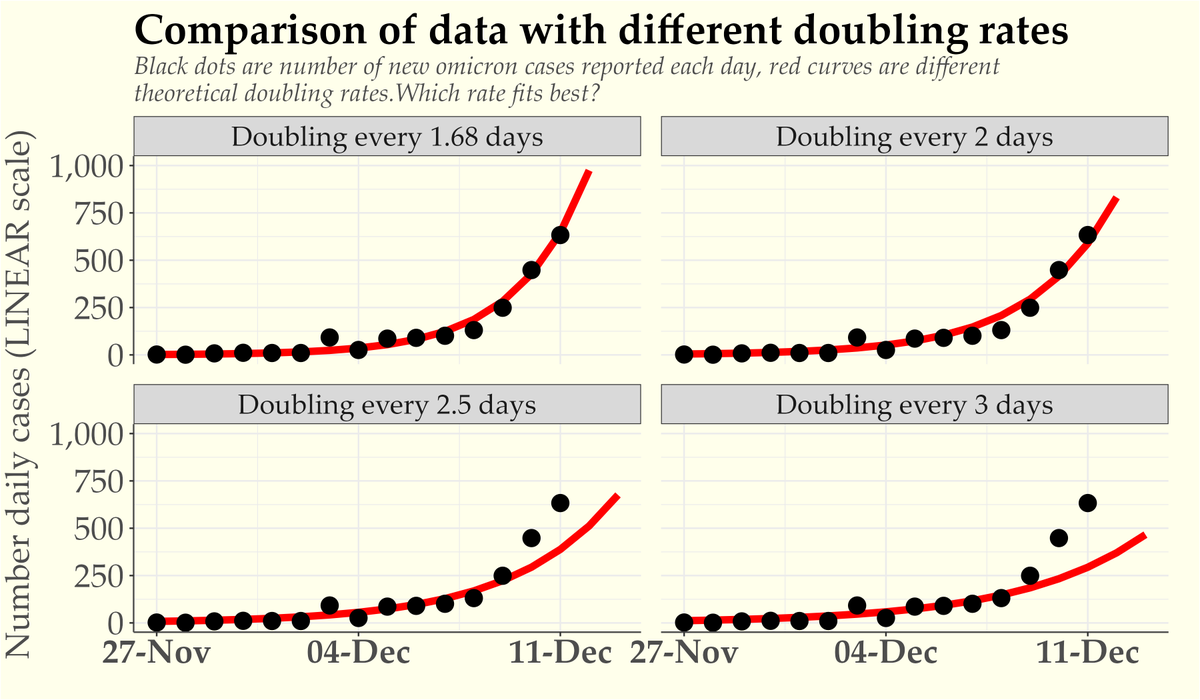
Here's an update of this chart for 9th Dec. The number of cases that we find is only a proxy measure for the true rate of infection, but the rate of growth is what's most interesting. It sems to be converging to a doubling rate of less than 2 days (current estimate is 1.68). Image
@JPWeiland has also been tracking the UK doubling rate (h/t @ForesightWisdom). This graph offers a good illustration of why it makes a difference whether this rate is 3 days or 2.5 days or (gulp) 1.6 days.
Update for 10th Dec. When I started plotting this graph the general view seemed to be that the doubling rate might be as fast as 3 days. That shifted to "2.5-3 days", and then "2-3 days". But the data are converging on a rate of 2 days or less (current est. = 1.68 days). Image
Update for 11th Dec. 633 new cases reported today, following the trend line very closely. The slope of that line *still* suggests that cases are doubling every 1.68 days. It could be slightly slower -- and I expect it will slow -- but right now 3 days is ridiculously optimistic. Image
Update for 12th Dec. 1239 new cases reported today, slightly above trend line. The slope of that line *still* suggests that cases are doubling every 1.7 days.

Or maybe, as someone suggested, we should say UK omicron cases are doubling every 40 hours. That concentrates the mind. Image
While I'm at it, here's an updated version of this plot. Still waiting for any credible explanation of the claim that the actual doubling rate is 2.5 or 3 days. Image
Thanks, though, to @kallmemeg, for this correction, which clears up one source of confusion re 3-day doubling claims.
This projection is cases, so:
a) number of infections will be greater, &
b) we don't have capacity to measure this many cases.

In practice the rate of growth will slow, but in the short term this will largely be due to changes in *behaviour* rather than immunity. Image
Update for 13th Dec. 1576 new cases reported today, following the trend line. The slope of that line *still* suggests that cases are doubling every 1.7 days.

#Every40Hours. Image

• • •

Missing some Tweet in this thread? You can try to force a refresh
 

Keep Current with Colin Davis

Colin Davis Profile picture

Stay in touch and get notified when new unrolls are available from this author!

Read all threads

This Thread may be Removed Anytime!

PDF

Twitter may remove this content at anytime! Save it as PDF for later use!

Try unrolling a thread yourself!

how to unroll video
  1. Follow @ThreadReaderApp to mention us!

  2. From a Twitter thread mention us with a keyword "unroll"
@threadreaderapp unroll

Practice here first or read more on our help page!

More from @ProfColinDavis

13 Dec
I'm continuing to see people talking about the rate at which sequenced Omicron cases are doubling as if it's a matter of interpretation, or something that different people could reasonably disagree on. It isn’t. It’s like 2+2.
Perhaps it would be useful for me to give a short tutorial on how to calculate doubling rates? It's actually very easy, when you know how. Is anyone interested in that?
OK, looks like there is some interest. So here's a short tutorial for people who never knew how to do this, or who are a bit rusty. I suspect there are a lot of people in this category, so I hope it’ll be useful to them. (I'll deal with qualifiers at the end of this thread).
Read 21 tweets
11 Dec
I shouldn't take it personally, but I am starting to feel rather gaslit by people (including experts) talking about omicron cases doubling every 3 days (or 2.5 days). I've plotted the data against different doubling rates below -- how fast do *you* think cases are doubling? Image
The graph above said "log scale" (I forgot to change the label), but it is obviously a linear scale (thanks @UncleJo46902375 ). Here's the correctly labelled version. Image
If you'd like to check my working (please do!), here are the data (two parts):

date newCases total
2021-11-2722
2021-11-2813
2021-11-29811
2021-11-301122
2021-12-011032
2021-12-021042
2021-12-0392134
2021-12-0426160
2021-12-0586246
2021-12-0690336

(cont'd)
Read 4 tweets
14 Nov
I feel a sense of deja vu, looking at Charnwood once again. It's interesting because it's one of those places where schools go back earlier than other parts of England, so it's a kind of canary in the Covid mine. Rates have grown steeply there in the last week in 5-14 year olds. Image
Although school age children have by far the highest rates in Charnwood, there is one adult age group that is catching up: 40-44 year olds. This is a familiar pattern. Image
The short thread below was the last time I looked at Charnwood. Showing typical caution in causal attribution I noted that the increase *could* just reflect "back-to-school testing". What happened subsequently suggests it wasn't.

Image
Read 6 tweets
12 Nov
Inspired by this thread, I thought I'd take a look back at some early (read: premature) assessments of the Covid situation among children following the return to school (in September and November). 🧵
I don't particularly mean to pick on @apsmunro (sorry if it seems like that). He's hardly the only optimist here -- this example is simply representative of a certain part of Covid Twitter in the first couple of weeks after schools went back in September.
Having said that, I do find it rather curious that a paediatrician would present a graph showing that many thousands of children were testing postive each day in England as cause for celebration or reassurance.
Read 14 tweets
6 Nov
Covid rates are down, so are we out of the woods? I'm afraid I'm pessimistic. Here's a thread 🧵on what's happened with rates lately and where things might be going (and another plea for additional measures beyond vaccines).
Rates among 10-14 year olds in England have see-sawed over the last month and a half. Not that they've ever got *low*, but the decline since half-term means that the latest rates are more or less equal to the rates on 19th September. (Note that the decline is flattening now).
The same can't be said for what's happened with adult rates over the same period-- those have gone up steadily, by 75% on average (rates have doubled in many groups, but increases have been much smaller among those in their 20s and 80s).
Read 9 tweets
30 Oct
It's been a long wait (it always is with JCVI) but we can finally read the JCVI minutes.

So let's take a look at their arguments against vaccination. 🧵
I'll focus on minutes from Thurs 13 May 2021, which sets out the arguments against vaccination. This has been attracting some attention, understandably, as it confirms the panel's interest in #HerdImmunityViaInfection

For a more comprehensive thread:
"Children rarely develop severe disease or die of COVID-19; even children with underlying comorbidities have a very low risk".

Really?

Over 10,000 children have been hospitalised in UK.

Over 100 children have died.

Over 10,000 have been ill for over a year (ONS estimate).
Read 16 tweets

Did Thread Reader help you today?

Support us! We are indie developers!


This site is made by just two indie developers on a laptop doing marketing, support and development! Read more about the story.

Become a Premium Member ($3/month or $30/year) and get exclusive features!

Become Premium

Too expensive? Make a small donation by buying us coffee ($5) or help with server cost ($10)

Donate via Paypal

Or Donate anonymously using crypto!

Ethereum

0xfe58350B80634f60Fa6Dc149a72b4DFbc17D341E copy

Bitcoin

3ATGMxNzCUFzxpMCHL5sWSt4DVtS8UqXpi copy

Thank you for your support!

Follow Us on Twitter!

:(