Inspired by this thread, I thought I'd take a look back at some early (read: premature) assessments of the Covid situation among children following the return to school (in September and November). 🧵
https://twitter.com/eliowa/status/1458585429809238023
I don't particularly mean to pick on @apsmunro (sorry if it seems like that). He's hardly the only optimist here -- this example is simply representative of a certain part of Covid Twitter in the first couple of weeks after schools went back in September.
https://twitter.com/apsmunro/status/1438158576216952836?s=20
Having said that, I do find it rather curious that a paediatrician would present a graph showing that many thousands of children were testing postive each day in England as cause for celebration or reassurance.
https://twitter.com/apsmunro/status/1438158576216952836?s=20
I see cases as bad, and lots of cases as very bad. But I suppose his point was that cases hadn't (yet) exploded following the start of school term.
OK, let's focus on one of those age groups (the one that does regular testing and wasn't subject to massive spikes over the summer).
OK, let's focus on one of those age groups (the one that does regular testing and wasn't subject to massive spikes over the summer).

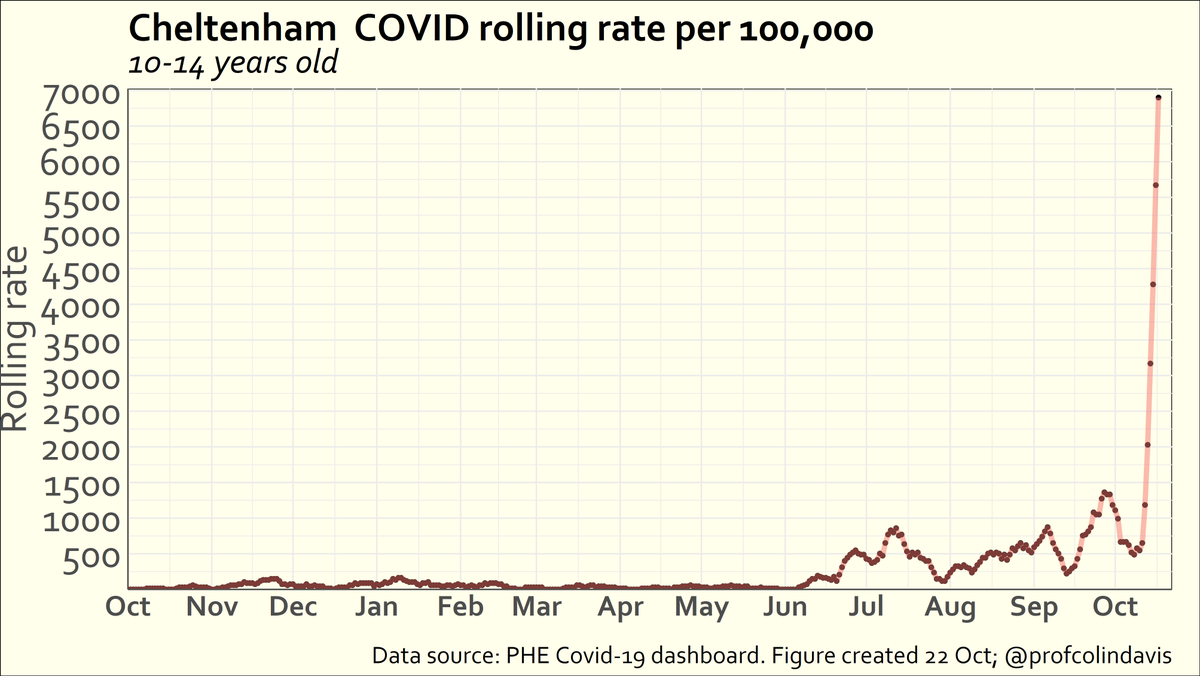
The first thing to note is that cases were already very high at this point -- not just in absolute terms, but in relative terms, as we can see if we zoom out over the course of the pandemic. 

Cases in this age group had gone up in the latter part of the school hols, which should've been a clear indication that herd immunity hadn't been reached following the spike at the end of the last school year. But with enough hope and reassurance you can ignore that sort of thing 

But those of us lacking that strict adherence to hope couldn't help noticing that schools hadn't introduced any mitigations over summer, and had removed the few protective measures that had been in place. From that perspective, what happened next was not exactly surprising.
Nor was it surprising when cases fell back down when schools closed for half-term (not sure if @apsmunro made a plot to show that). The fall was very steep and we've gone down to only about a third as many cases in 10-14s as at peak, but rates are still very high, overall. 

And yes, it is true that cases started to fall just before the end of term. But this was also expected: it's the pattern we've seen repeatedly. It probably reflects changes in testing behaviour (also worth noting that schools close earlier in some places).
https://twitter.com/SarahDRasmussen/status/1452602991064883211?s=20
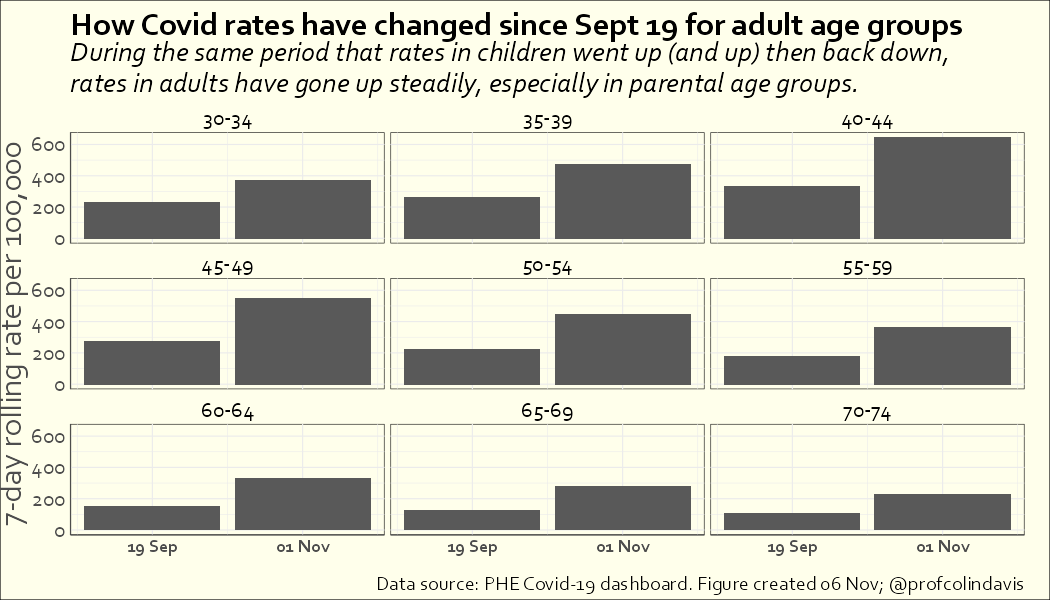
So here we are again, a couple of weeks into term, with cases having fallen quite dramatically in children (much less so in adults). Once again we hear invocations of herd immunity, and Dr Munro is along to spread hope.
https://twitter.com/apsmunro/status/1457344649090240516?s=20
A lot of people like hope, and who am I to interfere with them getting their fix? They're free to ignore me (and will). But FWIW, I can't see that children could have reached herd immunity yet, and the situation in schools hasn't improved, so my expectation is that ...
.. we'll see cases start to go back up in school-age children imminently. And then we'll start to see cases rising in parental age groups. And none of this will be helpful for the ongoing crisis in the NHS.
https://twitter.com/doctor_oxford/status/1457437378340065283?s=20
In the time since that tweet reminding us to be hopeful, and definitely not subject to fear, over half a million 10-14 year olds tested positive. That's tens of thousands of new #LongCovidKids. As well as the other implications.
https://twitter.com/jneill/status/1458905458882887681?s=20
So I would like to make another plea for realism, even if it's not as comforting as hope and reassurance. It's more important that we try to avert bad outcomes than reconcile ourselves to them, or worse (in my view) simply hope that they're not going to happen.
Time for #PlanB.
Time for #PlanB.
• • •
Missing some Tweet in this thread? You can try to
force a refresh


