Covid rates are down, so are we out of the woods? I'm afraid I'm pessimistic. Here's a thread 🧵on what's happened with rates lately and where things might be going (and another plea for additional measures beyond vaccines).
Rates among 10-14 year olds in England have see-sawed over the last month and a half. Not that they've ever got *low*, but the decline since half-term means that the latest rates are more or less equal to the rates on 19th September. (Note that the decline is flattening now).
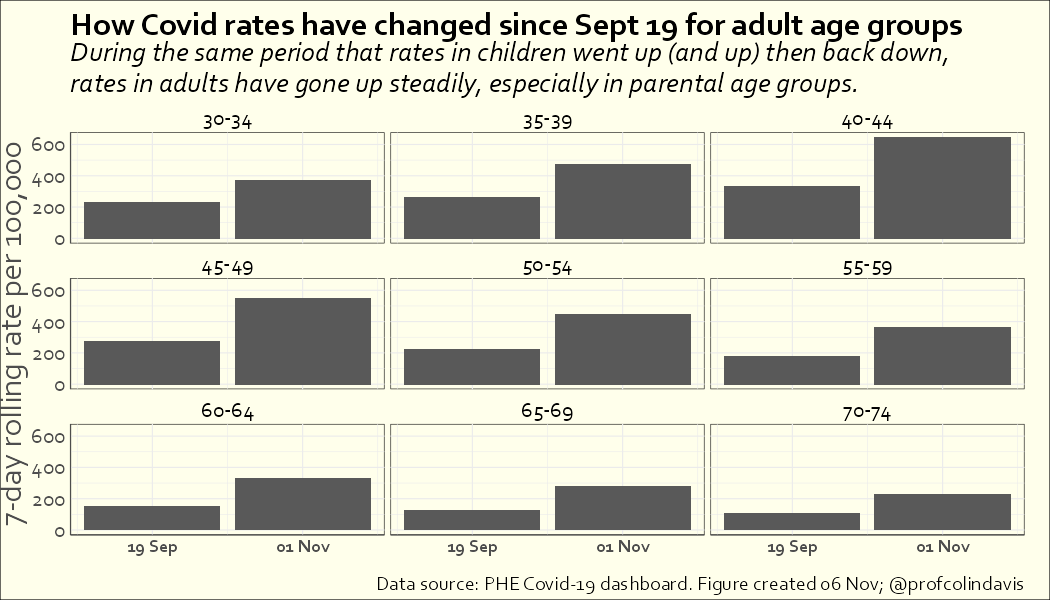
The same can't be said for what's happened with adult rates over the same period-- those have gone up steadily, by 75% on average (rates have doubled in many groups, but increases have been much smaller among those in their 20s and 80s).
And there's not much sign of a decrease in rates in adult groups. For them, half-term has been associated with a slowing, rather than a fall. If rates start to go up among children again (which seems likely, although vaccination will help), that will push adult rates up again.
It looks like we know how to rapidly increase rates among the unvaccinated (have them mix indoors with no mitigations), and how to rapidly decrease rates in that group (have them stop doing that). No surprise there. But getting rates down in adults requires additional measures.
We have a good idea what those additional measures are, and we can see how they've been applied successfully in other places. For example, we can look across the channel, where rates are a fraction of ours (less than one-sixth).
Looking at that comparison one might note that although the absolute rates are much higher in the UK than in France, our rates are going down, whereas their rates are curving up. But remember our rates have been going down among children, and the half-term effect is wearing off.
In France, rates have been going up among children recently, so guess what they're doing? (The headline says "Covid-19: the mask will return to primary school on Monday in 39 departments"). lemonde.fr/planete/articl…
Once again, those of us with misgivings are forced to ask, can we not learn from other countries?? Is it unpatriotic to follow France's lead? Must our PM pretend he's Harry, sending us once more unto the breach, dear friends, once more; Or close the wall up with our English dead.
• • •
Missing some Tweet in this thread? You can try to
force a refresh
It's been a long wait (it always is with JCVI) but we can finally read the JCVI minutes.
So let's take a look at their arguments against vaccination. 🧵
I'll focus on minutes from Thurs 13 May 2021, which sets out the arguments against vaccination. This has been attracting some attention, understandably, as it confirms the panel's interest in #HerdImmunityViaInfection
Last week I posted this thread about void PCR results. Today the latest testing stats were published, offering an opportunity to check if all the problems affecting testing have been resolved. They haven't - there are more void results than ever. Something is wrong with testing.
to be clear, the main reason for being interested in the % of void results is not that people misinterpret them as meaning they’re safe to go out (thought that probably happens). It’s that a high % of voids is a signal that something is going wrong in the testing process.
THREAD. Encouraged by @fascinatorfun, I've been taking a look at NHS Test & Trace data on void PCR results, hoping this might shed light on how different regions have been affected by the #Immensa lab failure. TL;DR there is a problem affecting labs, but not just for the SW.
If you’ve taken a PCR test, it’s possible (though not likely) that you’ll have had one of these - a void result. It means that the lab wasn’t able to read the sample, or some other problem prevented a definitive result (so you need to do another test). nhs.uk/conditions/cor…
@fascinatorfun noted that voids “often give a clue as to whether there are equipment issues, training needs or overstretched capacity resulting in people rushing and taking short cuts”. And as @OliasDave has shown, the void data are weird.
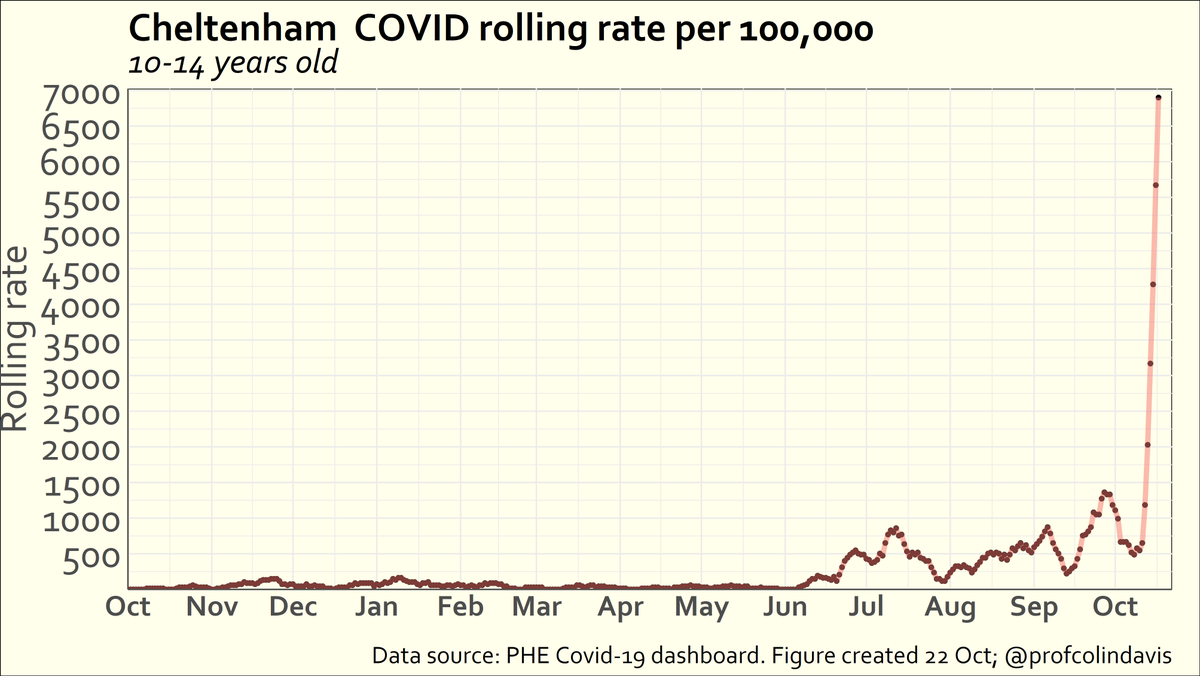
The 7-day rolling rates for 10-14s in the South West continue to rise alarmingly. In Cheltenham the rate has now reached 6900/100k (for comparison, Kettering, which previously had the highest ever rate for this age group, peaked at 6304/100k). Here's the graph since 1 September.
And for context, if we zoom out over the last year, the graph looks like this. I guess it's a relief that the half-term break is here, but I hope the holidays won't involve lots of socialising with extended family ...
In case you're wondering, having overtaken Kettering, Cheltenham moves into third place in the highest rolling rates in any year group. Second place is held by Nottingham 15-19 year olds (more specifically, 18 year olds in university halls at the start of term last year).
Now that Covid samples from the South West are being sent to a different lab, rolling rates are undergoing a rather dramatic adjustment. Here's a thread 🧵illustrating that, focusing on the rates for 10-14 year olds.
As a reminder, samples from the South West were being sent to a lab that (for reasons that have not yet been explained) was producing a high rate of false negatives.
This thread from yesterday noted that it was already apparent in September that something was fishy.
The case numbers for the South West of England had quite a few of us scratching our heads in September ... 🧵
I only just made that last graph now, and you might say it's easy to see in hindsight, but here's @OliasDave plotting the data a month ago (and already then, "Still convinced there is something odd going on").
This graph, also from @OliasDave in September, is a particularly nice way of visualising how weird the results for the South West were relative to the rest of the country.