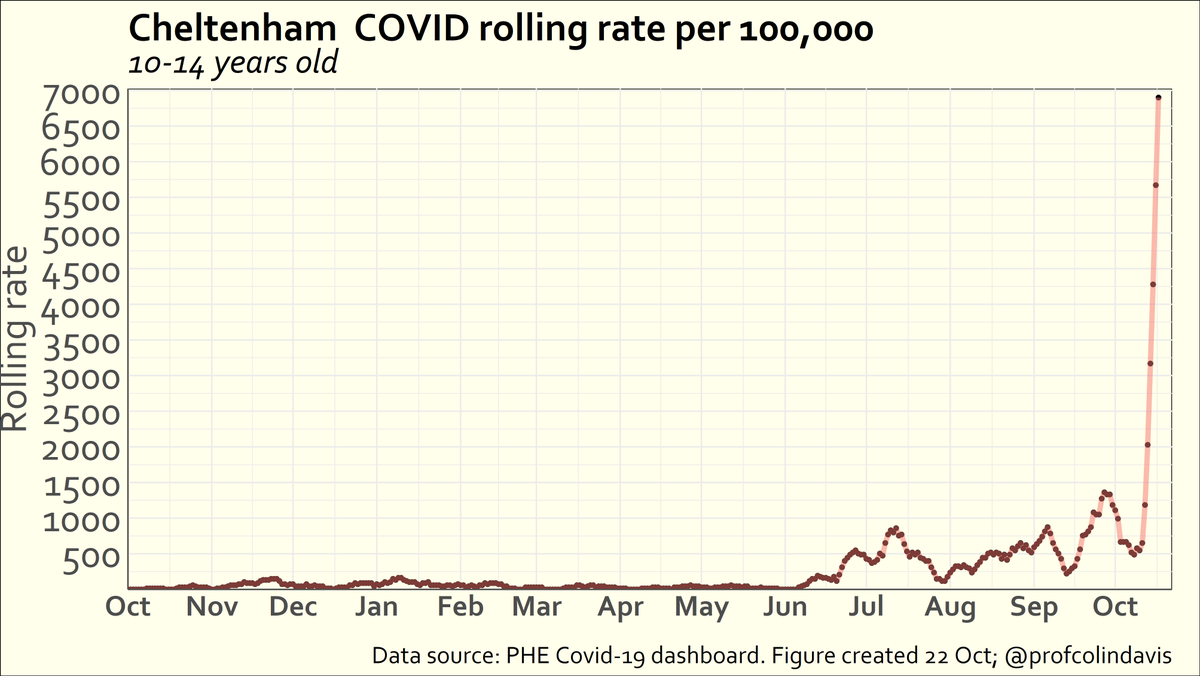
I feel a sense of deja vu, looking at Charnwood once again. It's interesting because it's one of those places where schools go back earlier than other parts of England, so it's a kind of canary in the Covid mine. Rates have grown steeply there in the last week in 5-14 year olds. Image
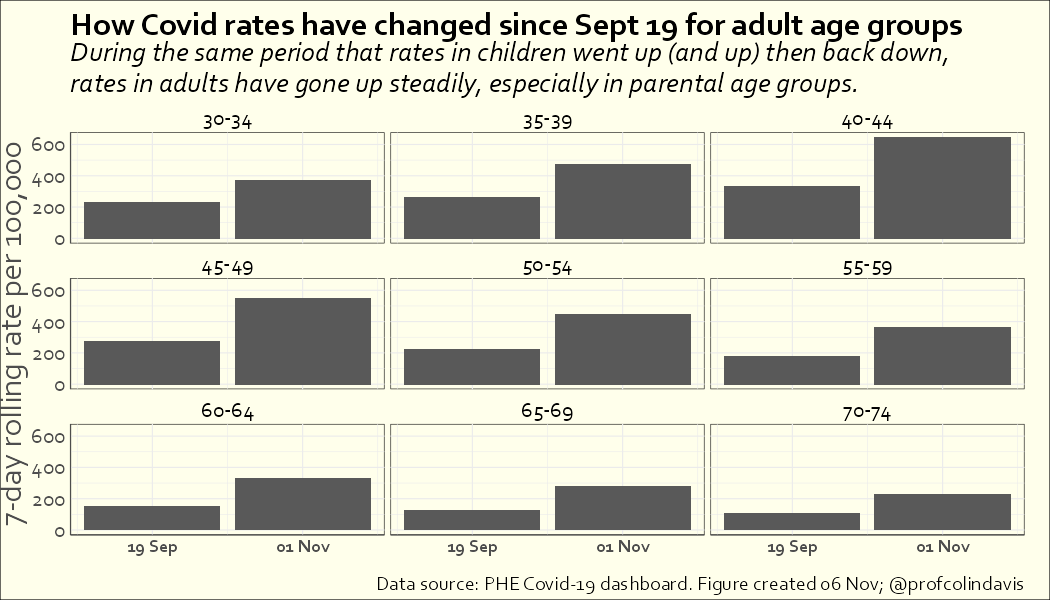
Although school age children have by far the highest rates in Charnwood, there is one adult age group that is catching up: 40-44 year olds. This is a familiar pattern. Image
The short thread below was the last time I looked at Charnwood. Showing typical caution in causal attribution I noted that the increase *could* just reflect "back-to-school testing". What happened subsequently suggests it wasn't.

Image
Other places that are showing rapidly increasing rates in children are Melton, Leicester, Newark & Sherwood, Oadby & Wigston, Hinckley & Bosworth, and Blaby. Of course, it *could* just be a coincidence that these are all areas in the East Midlands where schools went back earlier.
As a postscript, here're the latest available age-specific data from Melton. I believe the claim of herd immunity advocates is that places where rates got so high last term (4% testing positive in a week) should now resist further outbreaks. I guess the virus didn't get the memo. Image
Update on Charnwood: 1 in 50 5-9 year olds have tested positive for Covid in the last week. Image

• • •

Missing some Tweet in this thread? You can try to force a refresh
 

Keep Current with Colin Davis

Colin Davis Profile picture

Stay in touch and get notified when new unrolls are available from this author!

Read all threads

This Thread may be Removed Anytime!

PDF

Twitter may remove this content at anytime! Save it as PDF for later use!

Try unrolling a thread yourself!

how to unroll video
  1. Follow @ThreadReaderApp to mention us!

  2. From a Twitter thread mention us with a keyword "unroll"
@threadreaderapp unroll

Practice here first or read more on our help page!

More from @ProfColinDavis

12 Nov
Inspired by this thread, I thought I'd take a look back at some early (read: premature) assessments of the Covid situation among children following the return to school (in September and November). 🧵
I don't particularly mean to pick on @apsmunro (sorry if it seems like that). He's hardly the only optimist here -- this example is simply representative of a certain part of Covid Twitter in the first couple of weeks after schools went back in September.
Having said that, I do find it rather curious that a paediatrician would present a graph showing that many thousands of children were testing postive each day in England as cause for celebration or reassurance.
Read 14 tweets
6 Nov
Covid rates are down, so are we out of the woods? I'm afraid I'm pessimistic. Here's a thread 🧵on what's happened with rates lately and where things might be going (and another plea for additional measures beyond vaccines).
Rates among 10-14 year olds in England have see-sawed over the last month and a half. Not that they've ever got *low*, but the decline since half-term means that the latest rates are more or less equal to the rates on 19th September. (Note that the decline is flattening now).
The same can't be said for what's happened with adult rates over the same period-- those have gone up steadily, by 75% on average (rates have doubled in many groups, but increases have been much smaller among those in their 20s and 80s).
Read 9 tweets
30 Oct
It's been a long wait (it always is with JCVI) but we can finally read the JCVI minutes.

So let's take a look at their arguments against vaccination. 🧵
I'll focus on minutes from Thurs 13 May 2021, which sets out the arguments against vaccination. This has been attracting some attention, understandably, as it confirms the panel's interest in #HerdImmunityViaInfection

For a more comprehensive thread:
"Children rarely develop severe disease or die of COVID-19; even children with underlying comorbidities have a very low risk".

Really?

Over 10,000 children have been hospitalised in UK.

Over 100 children have died.

Over 10,000 have been ill for over a year (ONS estimate).
Read 16 tweets
28 Oct
Last week I posted this thread about void PCR results. Today the latest testing stats were published, offering an opportunity to check if all the problems affecting testing have been resolved. They haven't - there are more void results than ever. Something is wrong with testing. Image
The raw data can be downloaded from here: assets.publishing.service.gov.uk/government/upl…
to be clear, the main reason for being interested in the % of void results is not that people misinterpret them as meaning they’re safe to go out (thought that probably happens). It’s that a high % of voids is a signal that something is going wrong in the testing process.
Read 6 tweets
24 Oct
THREAD. Encouraged by @fascinatorfun, I've been taking a look at NHS Test & Trace data on void PCR results, hoping this might shed light on how different regions have been affected by the #Immensa lab failure. TL;DR there is a problem affecting labs, but not just for the SW.
If you’ve taken a PCR test, it’s possible (though not likely) that you’ll have had one of these - a void result. It means that the lab wasn’t able to read the sample, or some other problem prevented a definitive result (so you need to do another test). nhs.uk/conditions/cor…
@fascinatorfun noted that voids “often give a clue as to whether there are equipment issues, training needs or overstretched capacity resulting in people rushing and taking short cuts”. And as @OliasDave has shown, the void data are weird.
Read 20 tweets
22 Oct
The 7-day rolling rates for 10-14s in the South West continue to rise alarmingly. In Cheltenham the rate has now reached 6900/100k (for comparison, Kettering, which previously had the highest ever rate for this age group, peaked at 6304/100k). Here's the graph since 1 September. Image
And for context, if we zoom out over the last year, the graph looks like this. I guess it's a relief that the half-term break is here, but I hope the holidays won't involve lots of socialising with extended family ... Image
In case you're wondering, having overtaken Kettering, Cheltenham moves into third place in the highest rolling rates in any year group. Second place is held by Nottingham 15-19 year olds (more specifically, 18 year olds in university halls at the start of term last year). Image
Read 5 tweets

Did Thread Reader help you today?

Support us! We are indie developers!


This site is made by just two indie developers on a laptop doing marketing, support and development! Read more about the story.

Become a Premium Member ($3/month or $30/year) and get exclusive features!

Become Premium

Too expensive? Make a small donation by buying us coffee ($5) or help with server cost ($10)

Donate via Paypal

Thank you for your support!

Follow Us on Twitter!

:(