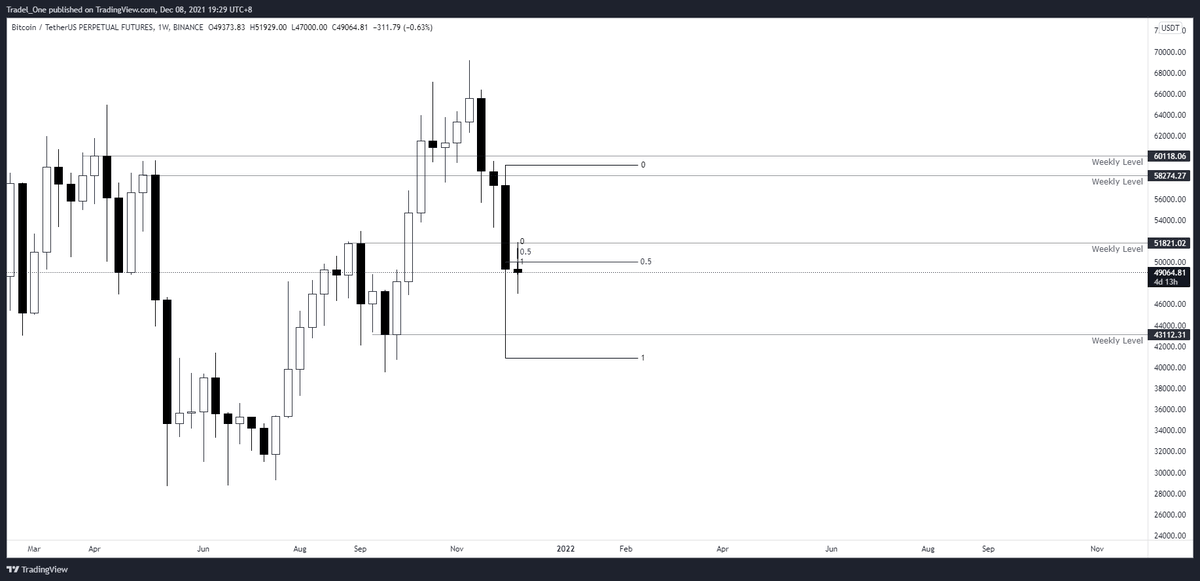
Where to for $BTC now?
When we look at the weekly range defined by the high and low of the previous week, ask yourself where your bias sits
Hopefully this breakdown introduces some logical thougth processes you may find value in
Where is the liquidity though?
#cryptocurrency
When we look at the weekly range defined by the high and low of the previous week, ask yourself where your bias sits
Hopefully this breakdown introduces some logical thougth processes you may find value in
Where is the liquidity though?
#cryptocurrency
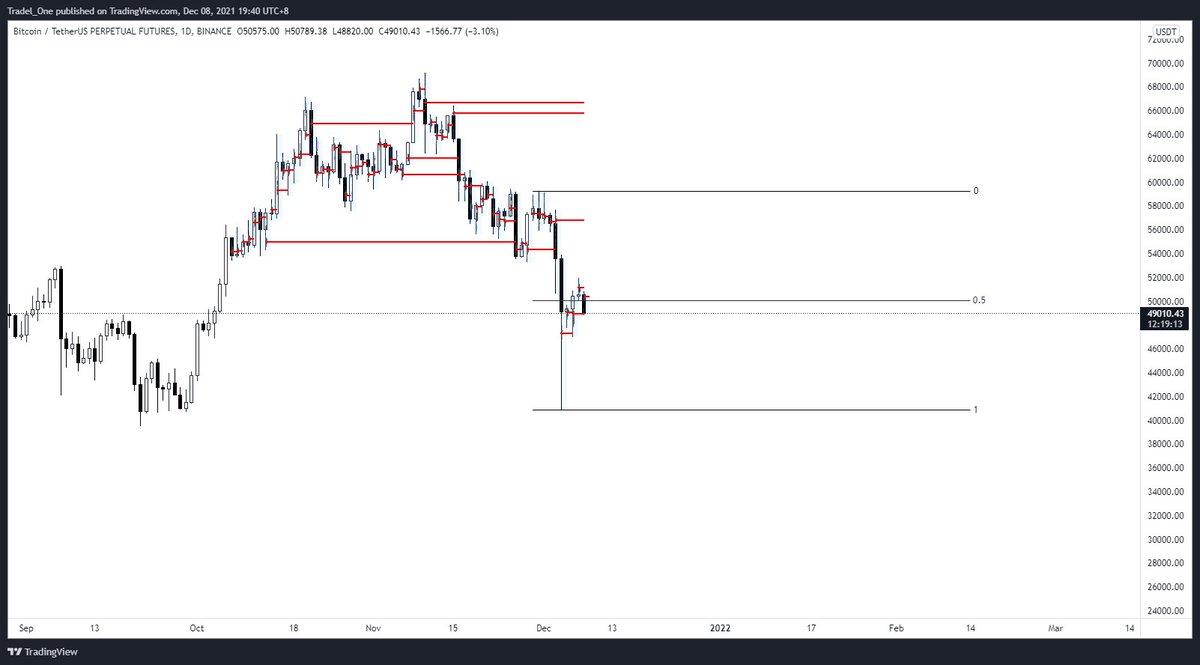
Orderblocks
You can see that we have some bullish orderblocks on the daily that we've tapped on the wick down from the recent move
And as shown in second pic, a bearish order block at range high
You can see that we have some bullish orderblocks on the daily that we've tapped on the wick down from the recent move
And as shown in second pic, a bearish order block at range high


FVG's
Looking on the Daily, we've also got three FVG's, with the recent wick move down filling and rendering this FVG as now closed
Looking on the Daily, we've also got three FVG's, with the recent wick move down filling and rendering this FVG as now closed

nPOC's
There is a close nPOC at $57k area, and also two more up near ATH.
From my end of the stick, it's not worth considering those two up top just yet though
There is a close nPOC at $57k area, and also two more up near ATH.
From my end of the stick, it's not worth considering those two up top just yet though
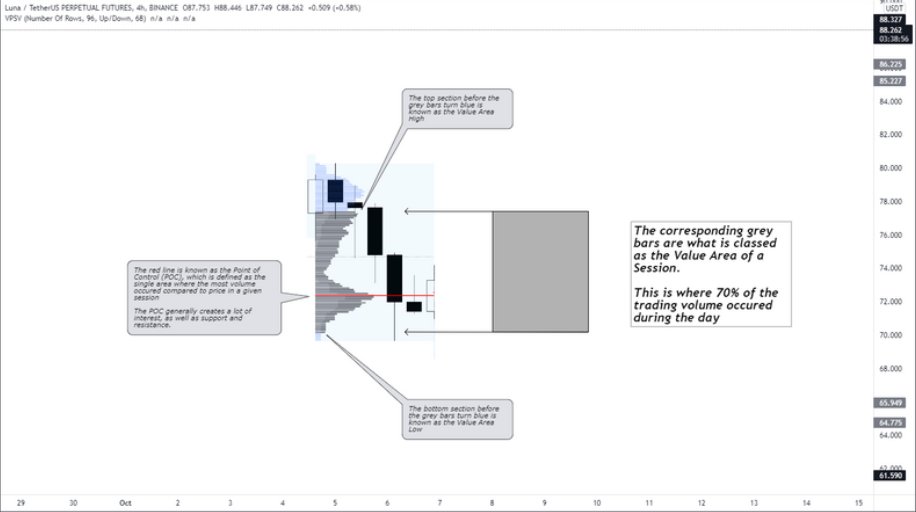
Value Areas
From a HTF perspective of the Fixed Range Volume Profile, where we pull the range from the low before the rally in July, and to current timeframe, we can see the below Value Areas
From a HTF perspective of the Fixed Range Volume Profile, where we pull the range from the low before the rally in July, and to current timeframe, we can see the below Value Areas

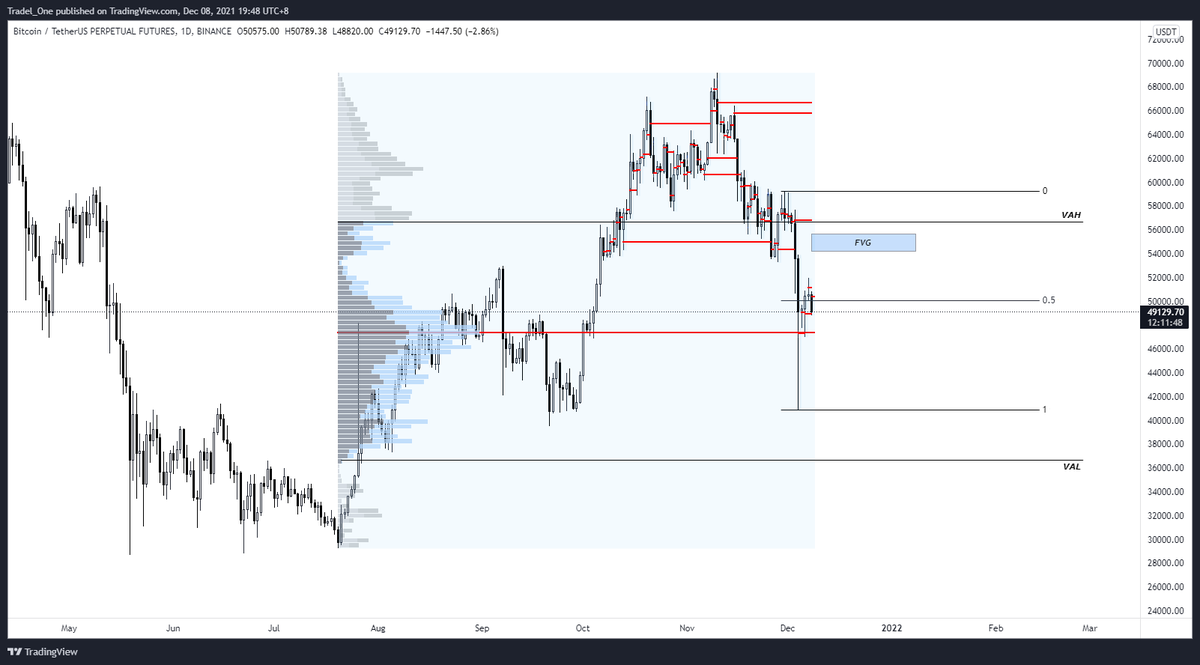
And then?
Look at the below chart and you'll find the VAH, a nPOC, and an FVG close to each other.
Everyone wants price to run down, but would it be ultimate fuckery to hit these points, and then run down to test range low?
Much rekt-ness in such a move
Look at the below chart and you'll find the VAH, a nPOC, and an FVG close to each other.
Everyone wants price to run down, but would it be ultimate fuckery to hit these points, and then run down to test range low?
Much rekt-ness in such a move
Price at the high of the range also lends itself to being at a complete premium compared to the fair value level of mid range, or the discounted lower range.
There would be a fair bit of market interest at the lows and highs of course.
There would be a fair bit of market interest at the lows and highs of course.
My take?
Well, for now, I'm happy to see what structure we beat in terms of lower timeframes that then allows me to frame my trading toward the highs or lows.
Lose that FRPV POC and I think we'll head to range low, but it also seems too juicy to not tap the range high as shown
Well, for now, I'm happy to see what structure we beat in terms of lower timeframes that then allows me to frame my trading toward the highs or lows.
Lose that FRPV POC and I think we'll head to range low, but it also seems too juicy to not tap the range high as shown
Hopefully this has helped a bit.
As always, say hi to the old chook for us, look after your mates, and keep out of trouble.
Thanks as always to @Delta_Exchange for their support, and if you'd like to trade there, feel free to use the below link
🍻
delta.exchange/MindsetBTC
As always, say hi to the old chook for us, look after your mates, and keep out of trouble.
Thanks as always to @Delta_Exchange for their support, and if you'd like to trade there, feel free to use the below link
🍻
delta.exchange/MindsetBTC
• • •
Missing some Tweet in this thread? You can try to
force a refresh