Update on #Omicron in SA via @Dr_Groome from @nicd_sa (presented @ Fri's @heatlhza press briefing):
[Thread]
1. The 7 day moving average of new #COVID19 cases = increased 40-fold between 16 Nov (332) + 8 Dec (13,237)
2. This increase is much steeper than in any previous wave
[Thread]
1. The 7 day moving average of new #COVID19 cases = increased 40-fold between 16 Nov (332) + 8 Dec (13,237)
2. This increase is much steeper than in any previous wave

2. @Dr_Groome:
1. The increase in new #COVID19 cases = mostly driven by Gauteng, where the #Omicron outbreak started
2. Left graph = absolute nr of cases, right graph = incidence (new cases), accounted for population size = starting to see increases in other provinces too
1. The increase in new #COVID19 cases = mostly driven by Gauteng, where the #Omicron outbreak started
2. Left graph = absolute nr of cases, right graph = incidence (new cases), accounted for population size = starting to see increases in other provinces too

3. What do new #COVID19 cases look like by age?
1. Early on in the #Omicron wave we saw more cases in younger age groups
2. Currently, the incidence is highest in the 20-39 year and 40-59 year group, followed by the 60+ year group
1. Early on in the #Omicron wave we saw more cases in younger age groups
2. Currently, the incidence is highest in the 20-39 year and 40-59 year group, followed by the 60+ year group

4. @Dr_Groome:
There has been a dramatic increase in the test positivity rate (the % of tests that come out positive) - this increase is steeper than in any previous wave:
- Between 14 + 28 Nov the + rate increased from 2.5% to 24.9%
- Yesterday (Thu), the + rate was: 29.8%
There has been a dramatic increase in the test positivity rate (the % of tests that come out positive) - this increase is steeper than in any previous wave:
- Between 14 + 28 Nov the + rate increased from 2.5% to 24.9%
- Yesterday (Thu), the + rate was: 29.8%

5. @Dr_Groome:
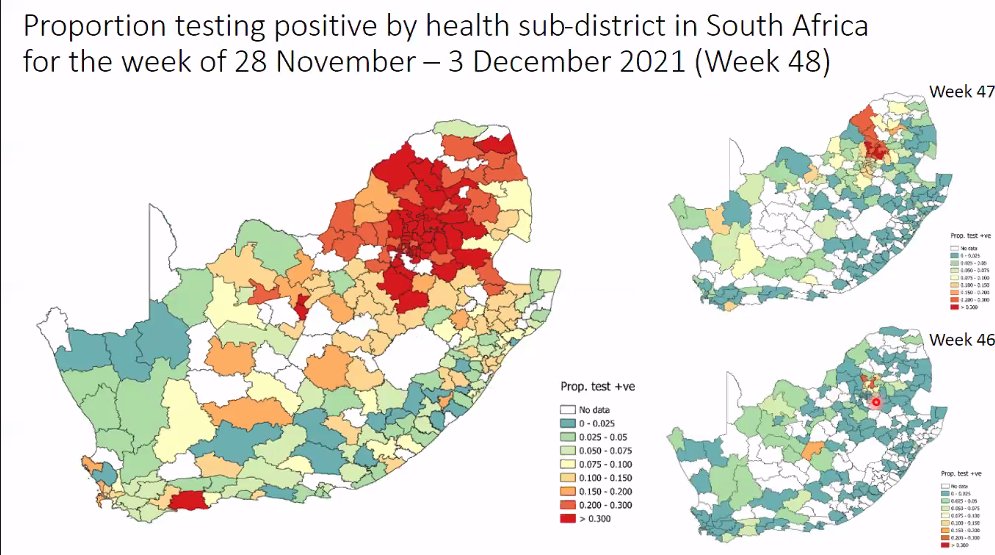
1. This is how positivity test rates are distributed across SA (red = over 30%)
2. See how the red is concentrated in the north of SA in Gauteng, but is now filtering to the rest of the country
1. This is how positivity test rates are distributed across SA (red = over 30%)
2. See how the red is concentrated in the north of SA in Gauteng, but is now filtering to the rest of the country

6. @Dr_Groome:
1. This is a table of test positivity rates for provinces
2. Gauteng's (35%) + rate is the highest (where the #Omicron outbreak in SA started), followed by Northwest, MP and Limpopo (all 3 = neighboring provinces of GP)
1. This is a table of test positivity rates for provinces
2. Gauteng's (35%) + rate is the highest (where the #Omicron outbreak in SA started), followed by Northwest, MP and Limpopo (all 3 = neighboring provinces of GP)

7. Which SA provinces have officially entered a 4th wave?
@Dr_Groome:
1. Gauteng
2. Northwest
3. Mpumalanga
@Dr_Groome:
1. Gauteng
2. Northwest
3. Mpumalanga

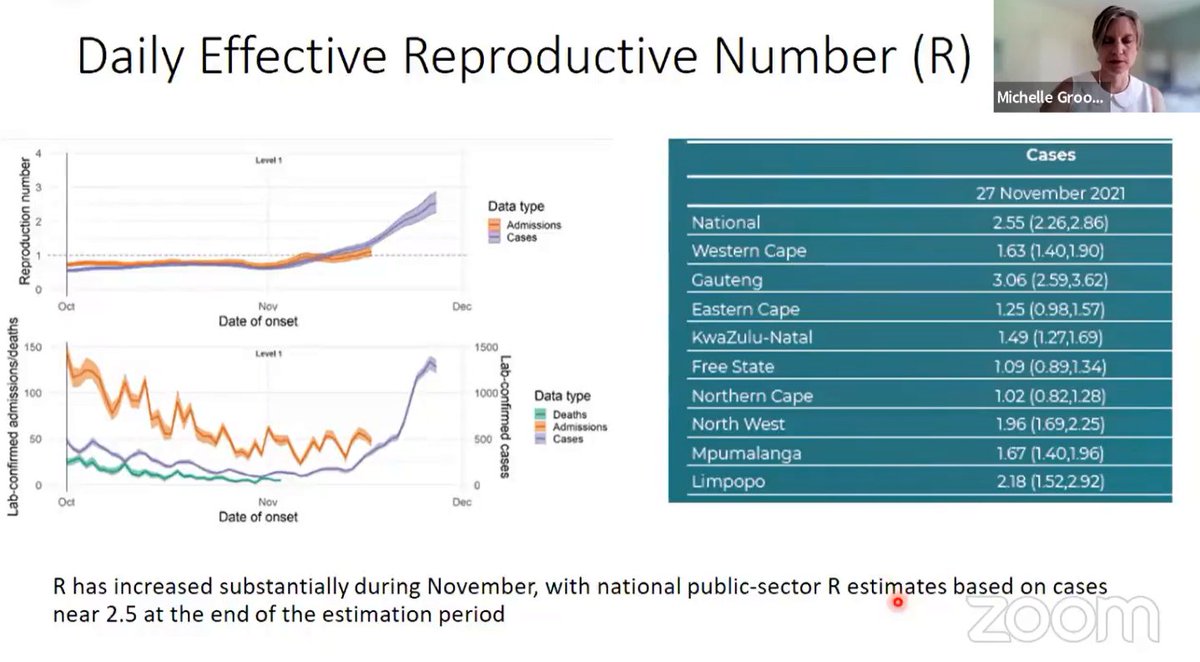
8. What's happening with reproductive (R) numbers? (This is how many other people 1 infected person will infect):
1. Nationally our R nr = 2.55 (this is the highest R nr SA has seen since the start of #COVID19)
2. In Gauteng (where SA's #Omicron outbreak started) the R nr = 3.06
1. Nationally our R nr = 2.55 (this is the highest R nr SA has seen since the start of #COVID19)
2. In Gauteng (where SA's #Omicron outbreak started) the R nr = 3.06

9. What's happening with hospitalisations?
1. The right graph shows the increase in hospitalisations in both the private and public sector
2. The left graph shows a drop off, but that is due to a delay in the reporting of cases, not an actual drop in cases
1. The right graph shows the increase in hospitalisations in both the private and public sector
2. The left graph shows a drop off, but that is due to a delay in the reporting of cases, not an actual drop in cases

10. The left graph compares the nr of new cases (orange) with hospital admissions (grey) for all waves:
The diffs with the 4th (#Omicron) wave = admissions start later (a while after a steep increase in cases; admissions in previous waves = along with an increase in cases).
The diffs with the 4th (#Omicron) wave = admissions start later (a while after a steep increase in cases; admissions in previous waves = along with an increase in cases).

11. Early indications of #Omicron hospitalisations, based on SA data:
1. We're starting to see a disconnect between cases and hospitalisations
2. Right graph = there is a much lower % of patients getting admitted (blue) - but could be because it's still early in the wave
1. We're starting to see a disconnect between cases and hospitalisations
2. Right graph = there is a much lower % of patients getting admitted (blue) - but could be because it's still early in the wave

12. What's happening with #COVID19 deaths?
1. We haven't seen any significant increase nationally
2. We're starting to see small increases in Gauteng (where SA's #Omicron outbreak started)
1. We haven't seen any significant increase nationally
2. We're starting to see small increases in Gauteng (where SA's #Omicron outbreak started)

13. This table shows increases in #COVID19 hospital admissions/deaths in provinces:
1. Gauteng: Increase from an average of 32.57 (for 2 weeks) to 181.07 (the average of the following 2 weeks) = 455% increase
2. Deaths in Gauteng = 68% increase
1. Gauteng: Increase from an average of 32.57 (for 2 weeks) to 181.07 (the average of the following 2 weeks) = 455% increase
2. Deaths in Gauteng = 68% increase

14. AGE breakdown 4 GAUTENG admissions (last 3 weeks):
1. We started off with a larger % of admissions in younger (20/below) groups, but that is now changing
2. We're now seeing the % of younger admissions decreasing + the % of admissions in older groups (slightly) increasing
1. We started off with a larger % of admissions in younger (20/below) groups, but that is now changing
2. We're now seeing the % of younger admissions decreasing + the % of admissions in older groups (slightly) increasing

15. GAUTENG admission data broken down into smaller age bands:
1. 0-5 years = a high % of admissions initially, but this has decreased from 14% of admissions to 7% of admissions over the last 3 weeks
2. 60+ admissions have increased from about 13% to just over 16%
1. 0-5 years = a high % of admissions initially, but this has decreased from 14% of admissions to 7% of admissions over the last 3 weeks
2. 60+ admissions have increased from about 13% to just over 16%

16. @Dr_Groome:
1. This graph shows that the #COVID19 admissions we're seeing are mostly among the age groups with low vaccination rates
2. This is in line with evidence that vaccines protect people from falling severely ill with COVID (so they don't need hospitalisation)
1. This graph shows that the #COVID19 admissions we're seeing are mostly among the age groups with low vaccination rates
2. This is in line with evidence that vaccines protect people from falling severely ill with COVID (so they don't need hospitalisation)

17. What is defined as severe illness?
= People with acute respiratory distress syndrome, those needing oxygen or are admitted to ICU
Note: The data presented = early stage data, which means many beds = still available + docs are more likely to admit patients with mild disease
= People with acute respiratory distress syndrome, those needing oxygen or are admitted to ICU
Note: The data presented = early stage data, which means many beds = still available + docs are more likely to admit patients with mild disease

18. Summary:
1. The nr of new #COVID19 cases are on a sharp increase and so is the test positivity rate
2. % of younger admissions = changing (becoming a smaller % of total admissions)
3. No signals of more severe disease
4. Most hospital admissions = unvaccinated people
1. The nr of new #COVID19 cases are on a sharp increase and so is the test positivity rate
2. % of younger admissions = changing (becoming a smaller % of total admissions)
3. No signals of more severe disease
4. Most hospital admissions = unvaccinated people

• • •
Missing some Tweet in this thread? You can try to
force a refresh


