Zoomers' wages are growing really fast. Median over-the-year growth within worker into the last 3 months is almost 10%, but less fast than last 2 months showed.

Acceleration in prime-age and older workers too. Image
Splitting up the age groups more finely shows acceleration in a lot of age groups, though lots of noise. Image
The @AtlantaFed presents median over-the-year trends by age group averaging over the growth into the last 12 months, rather than the last 3 as I did.

What I'm doing is somewhat inadvisable due to noise & small sample. Life on the bleeding edge seeking to detect rapid change.
@AtlantaFed Here are 12-month versions for comparison. For Zoomers, it looks like wage growth is accelerating above 10%. ImageImage
The quarter of workers who made the least in Sept-Nov 2020 had the fastest growth over the year to Sept-Nov 2021, a median within-worker growth rate of just under 6%.

2nd quartile also experienced acceleration, now growth almost as fast at 1st. Others slower. Image
Here are the 3- and 12- month moving averages of median wage growth in a few industries.

In the 3-month, there's little difference between Leisure & Hospitality, Trade & Transport, or Education & Hospitality... all around 4%. ImageImage
In the 12-month, workers in these 3 sectors -- Construction & Mining, Finance & Business Services, and Manufacturing -- all also experienced median growth of about 4%.

Focusing on most recent months, Construction & Mining is a bit lower & others higher. ImageImage
Wage growth for non-white workers looks to have accelerated up to 6%, but it's quite noisy so I want to see if the pattern holds. Image
Using the WGT 12-month average of median wage growth, we see job switchers at around 4% and stayers just over 3%.

But focusing on the most-recent 3 months shows recent acceleration in both series, with switchers around 5% and stayers around 4%. ImageImage
Young (16-29 years old) switchers in recent months have wage median growth around 12%

Young stayers around 6%. ImageImage
30-44 year old switchers around 6%, stayers around 4%. ImageImage
45-59 year olds switchers a little above stayers, around 3%. ImageImage
60+ year olds getting growth in the 2-3% range. ImageImage
For 25% of people employed both recently & 12 months, their hourly wage grew by 16% or more. Just over 25% saw their wage decline.

Average growth (6.0%) > median (4.3%), given positive skew in over-the-year hourly wage growth rates into the last 3 months. Image

• • •

Missing some Tweet in this thread? You can try to force a refresh
 

Keep Current with Aaron Sojourner

Aaron Sojourner Profile picture

Stay in touch and get notified when new unrolls are available from this author!

Read all threads

This Thread may be Removed Anytime!

PDF

Twitter may remove this content at anytime! Save it as PDF for later use!

Try unrolling a thread yourself!

how to unroll video
  1. Follow @ThreadReaderApp to mention us!

  2. From a Twitter thread mention us with a keyword "unroll"
@threadreaderapp unroll

Practice here first or read more on our help page!

More from @aaronsojourner

13 Dec
Younger American workers experienced average growth in their own hourly wages that significantly outpaced average price growth (CPI-U) over the last year.

Middle-aged workers' wage growth lagged price growth a bit.

@arindube's graph below inspired this analysis. Image
This differs from @BLS_gov's official real wage growth measure. That focuses on change in average hourly earnings among those employed now & those employed a year ago, mixing wage changes for people employed both times (what I focus on) with changes in the kind of people employed
Read 12 tweets
11 Dec
Senate Republicans who opposed Hurricane Sandy relief after supporting relief for their own states.
archive.thinkprogress.org/31-senate-repu…
Senator Rand Paul (R-KY) spoke about his opposition to the disaster aid bill in response to Hurricanes Harvey, Irma, and Maria and wildfires in California.
c-span.org/video/?436237-…
Read 4 tweets
5 Dec
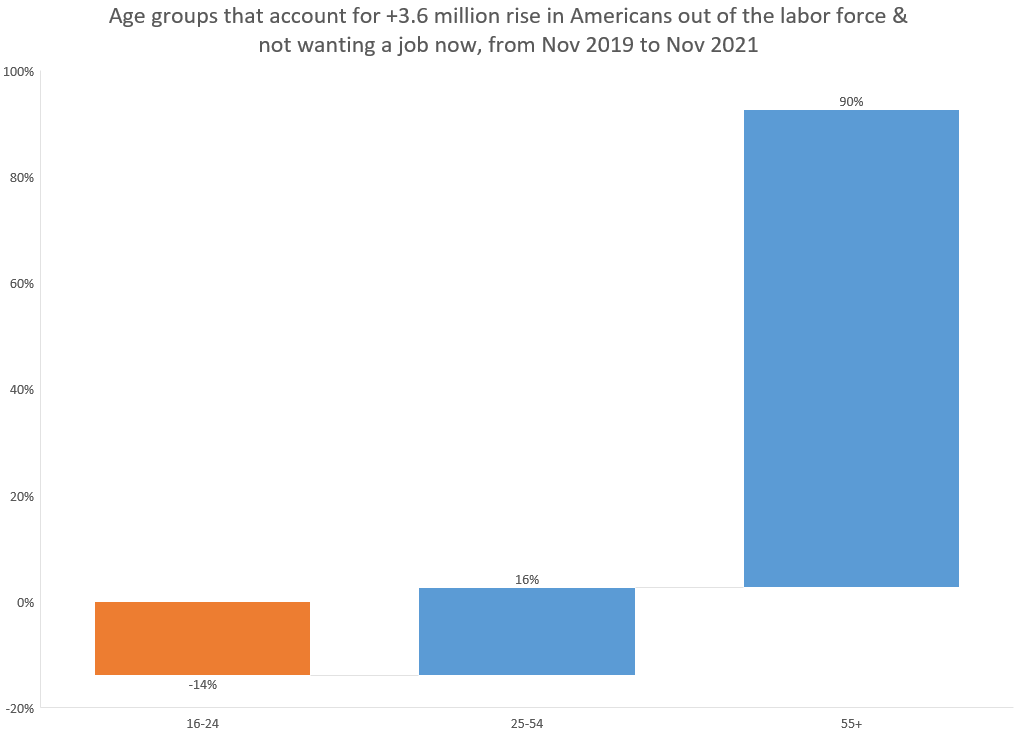
Known: older Americans have exited the labor force in disproportionate numbers.

Unknown: how many will come back?

3.6 million more Americans are out of the labor force & not wanting a job now versus 2 years ago. Older Americans (55+) account for 90% of that increase.
What's affecting decision to work vs not?

⬇️value of Work: COVID risks, ⬇️job quality, lack of nominal wage acceleration.

⬆️value of Not Work: helping (grand)kids w/care, any new non-labor income/wealth.
Over a million extra retirements occurred early in the pandemic, per @KansasCityFed research.
kansascityfed.org/research/econo…
Read 13 tweets
3 Dec
Happy #JobsDay. Hope you’re staying healthy. #HappyHanukkah.

At 8:30 am ET @BLS_gov delivers the most-important signals abt how economy is changing.

Forecasts’ center:

+573K jobs
4.5% unemployment rate, down 0.1 percentage point (pp)
Americans have gained more income & enjoy higher levels of wealth than ever before.

We want to buy. Consumer and labor demand is high.
Biggest question in the economy: how quickly can we raise supply? Bring more labor & capital to production & boost productivity.

Success means more consumption & lower prices. COVID health risks at home & abroad remain the big obstacle, making work riskier.
Read 22 tweets
18 Nov
A silver lining from COVID's adoption of remote working options?

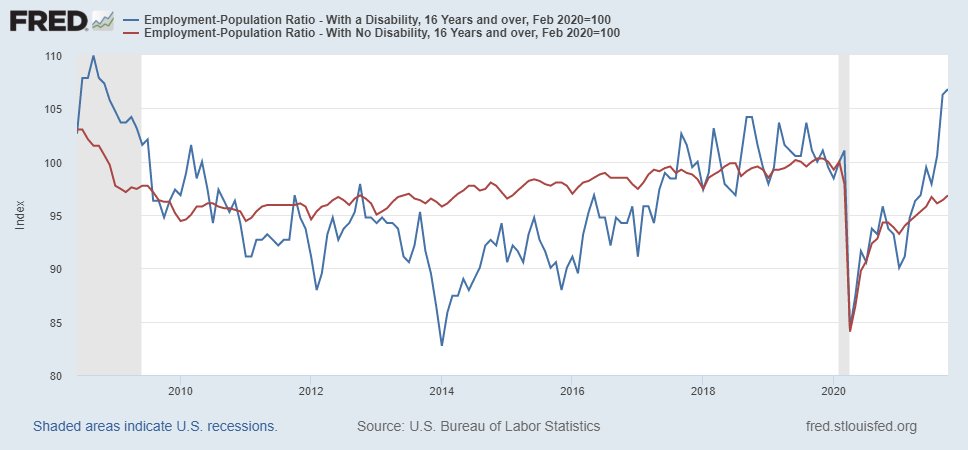
A higher share of Americans with a disability are employed now than pre-pandemic, 20.4%.

Meanwhile, employment rate for Americans with no disability remain below pre-pandemic.

=> shift in relative productivity?
A source of talent employers may overlook and should investigate.
Perhaps the pandemic caused disability among previously employed people?

Doesn't look like it. The populations with and without disability have grown at about the same rate since the start of the pandemic. Both trends indexed = 100 in Feb 2020.
Read 4 tweets
16 Nov
U.S. corporations have higher profits than ever before.
Profits ⬆️ 17% in the last 2 years. Image
U.S. equity investors enjoying record high stock market, consistent with record high expected future profits ahead.

Wilshire Total Market Full Cap Index ⬆️ 58% in the last 2 years. Image
U.S. workers have more job opportunities than ever on record.

In recent months, more openings in total or as a share of jobs than ever before in records back to two decades.

Job opening rate ⬆️47% in last 2 years, compared to pre-pandemic Sept 2019. Image
Read 25 tweets

Did Thread Reader help you today?

Support us! We are indie developers!


This site is made by just two indie developers on a laptop doing marketing, support and development! Read more about the story.

Become a Premium Member ($3/month or $30/year) and get exclusive features!

Become Premium

Too expensive? Make a small donation by buying us coffee ($5) or help with server cost ($10)

Donate via Paypal

Or Donate anonymously using crypto!

Ethereum

0xfe58350B80634f60Fa6Dc149a72b4DFbc17D341E copy

Bitcoin

3ATGMxNzCUFzxpMCHL5sWSt4DVtS8UqXpi copy

Thank you for your support!

Follow Us on Twitter!

:(