Younger American workers experienced average growth in their own hourly wages that significantly outpaced average price growth (CPI-U) over the last year.
Middle-aged workers' wage growth lagged price growth a bit.
@arindube's graph below inspired this analysis.
Middle-aged workers' wage growth lagged price growth a bit.
@arindube's graph below inspired this analysis.
https://twitter.com/arindube/status/1457156787828891657

This differs from @BLS_gov's official real wage growth measure. That focuses on change in average hourly earnings among those employed now & those employed a year ago, mixing wage changes for people employed both times (what I focus on) with changes in the kind of people employed
@BLS_gov Change in average hourly earnings (AHE) of employed gives a good, timely approximation of wage growth when the composition of workers is stable.
But when composition changes, it can mislead. Disproportionate lay offs of low-wage in pandemic look like big wage increases!
But when composition changes, it can mislead. Disproportionate lay offs of low-wage in pandemic look like big wage increases!

The Wage Growth Tracker method I used here only focuses on over-the-year wage change among individuals employed in both periods, so it doesn't get as confused by compositional change (tho there's an issue of who's employed in both periods).
Another kind of compositional change is always happening & pushes down AHE-based measures always.
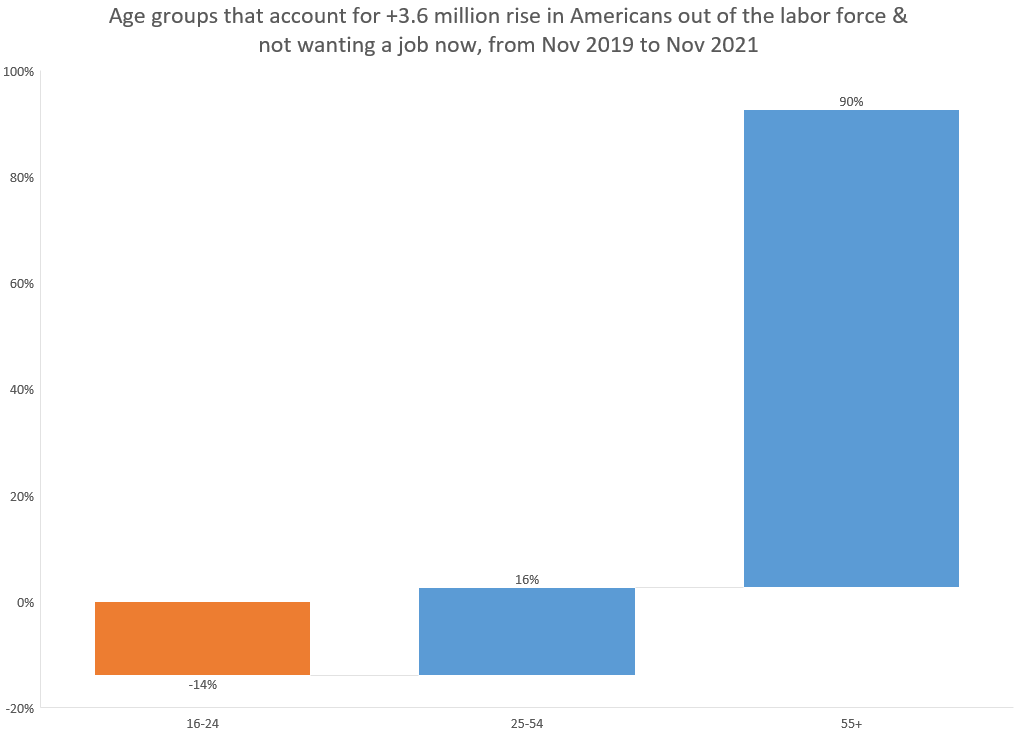
Every month, the workers permanently leaving employment are older & higher-wage than entrants.
My sense: this retiree-entrant bias pushes AHE abt 2% below within-worker growth.
Every month, the workers permanently leaving employment are older & higher-wage than entrants.
My sense: this retiree-entrant bias pushes AHE abt 2% below within-worker growth.
Within-worker measures (WGT) can minimize compositional biases in times of rapid change, but it also "corrects" for retiree-entrant bias, which is a perennial issue.
The official real hourly earnings measure is change in AHE minus change in a consumer price index (CPI-U).
The official real hourly earnings measure is change in AHE minus change in a consumer price index (CPI-U).
Is younger workers' faster wage growth bcz they're more likely to switch jobs or work in a particular industry?
Predicting average wage growth in the individual level data for the most-recent 3 months yields the following estimates.
Age dominates, controlling for lots else.
Predicting average wage growth in the individual level data for the most-recent 3 months yields the following estimates.
Age dominates, controlling for lots else.

Controls for age, salary, job switching, gender, educ, part/full time, occ skill group, industry, coarse race, MSA status, region, and wage quartile.
Caution & more work is warranted here. Data may be thin, not using weights.... But suggestive.
Caution & more work is warranted here. Data may be thin, not using weights.... But suggestive.
Comparing the Sept-Nov 2021 coefficients to those from Sept-Nov 2019 shows that associations with age have grown, while most other factors have changed less.
Sorry for the terrible labelling. It's a pain to clean up.
Sorry for the terrible labelling. It's a pain to clean up.

Another difference is that the official measures focus on over-the-year change into each single month. This pools over-the-year change into 3 months to get sample size.
I averaged CPI-U growth over the same 3 for comparability.
I averaged CPI-U growth over the same 3 for comparability.
For answering, "how much has the average workers' buying power from an hour of labor changed over the year?", this has some real strengths over the official measure, especially now.
Tho I acknowledge that straying from official measures opens up cans of worms.
Tho I acknowledge that straying from official measures opens up cans of worms.
• • •
Missing some Tweet in this thread? You can try to
force a refresh