10 #Bitcoin Cycle Top Price Prediction Models
📈(in ascending order of hopium)
🔬Let's review 10 popular price models for $BTC to see where we could potentially peak.
☝️ BONUS - These targets will INCREASE with time as uptrend will push model prices upward🚀
🧵A Thread [0/11]
📈(in ascending order of hopium)
🔬Let's review 10 popular price models for $BTC to see where we could potentially peak.
☝️ BONUS - These targets will INCREASE with time as uptrend will push model prices upward🚀
🧵A Thread [0/11]

$BTC Mayer Multiple - by @tracemayer is a price projection calculated as a 2.4 multiple of the #bitcoinprice 200DMA.
🦥Looking at the chart we can see $122,034 is our most conservative price estimate.
💥Bitcoin has overshot this multiple in EVERY cycle peak.
👉 next up
1/11
🦥Looking at the chart we can see $122,034 is our most conservative price estimate.
💥Bitcoin has overshot this multiple in EVERY cycle peak.
👉 next up
1/11

BTC Power Law Corridor by @hcburger1 takes linear regression bands of the historical #bitcoin price to derive a corridor to represent the correlation between bitcoin’s price and time.
🎯$130,622 target
🟢 price is in middle of corridor uptrend
👉 but we can go higher...
2/11
🎯$130,622 target
🟢 price is in middle of corridor uptrend
👉 but we can go higher...
2/11

Bitcoin #Logarithmic Growth Curves - by @ColeGarnerXBT is BTC's adoption curve channel with key fib levels.
🎯$144,208 target
🏋️Price sitting at Fib 382 support level
👉higher still is...
3/11
🎯$144,208 target
🏋️Price sitting at Fib 382 support level
👉higher still is...
3/11

Bitcoin Price Temperature by @dilutionproof is calculating the difference between the daily price and its 4-year moving average, and then dividing that number by the standard deviation of that 4-year window
🎯$157,291 #BTCUSD target
📈3X+
👉 but let's go higher!
4/11
🎯$157,291 #BTCUSD target
📈3X+
👉 but let's go higher!
4/11

Bitcoin #DiamondHands MVLV Bands - inspired by @dilutionproof modifies LTH to use 6mo+ cohorts.
A measure of Market Value to Long term Value.
💎👐could get you to $162,406 $BTC
🫕now we're cooking with gas
👉but... we can still level up from here
5/11
A measure of Market Value to Long term Value.
💎👐could get you to $162,406 $BTC
🫕now we're cooking with gas
👉but... we can still level up from here
5/11

#Bitcoin Rainbow Price Chart - by trolololo on the original Bitcointalk.org forum
🌶️Max bubble target zone of $179,797
🛏️That's a price I can get out of bed for
👉 but wait.. there's even more
6/11
🌶️Max bubble target zone of $179,797
🛏️That's a price I can get out of bed for
👉 but wait.. there's even more
6/11

Binkie Bands Top Price Model - inspired by the legend @woonomic which modifies his top cap model with a tighter multiple fit.
🎯$202,863 target
🔥+4X return from here
👉 Onward and upward to the next target...
7/11
🎯$202,863 target
🔥+4X return from here
👉 Onward and upward to the next target...
7/11

BEAM Bands by @BitcoinEcon divides the price of bitcoin at any given moment to a moving average of past prices
BEAM = log( Price(n) / MA( min(n,1400) ) ) / 2.5
🎯$220,396 target
🚗now we're in entry level lamborghini territory
👉 go higher you say?
8/11
BEAM = log( Price(n) / MA( min(n,1400) ) ) / 2.5
🎯$220,396 target
🚗now we're in entry level lamborghini territory
👉 go higher you say?
8/11

#BTC Golden Ratio by @PositiveCrypto uses multiples of the 350DMA of Bitcoin's price to identify areas of potential upward resistance
🎯$235,565
📈4.77 X from here👀
👉 but can we still go higher???
9/11
🎯$235,565
📈4.77 X from here👀
👉 but can we still go higher???
9/11

Stock to Flow Cross Asset Model (S2FX) by @100trillionUSD Plan B removes time from the original S2F model to value multiple SOV assets like #gold or #silver or #bitcoin.
🎯$235,572 target
🤯Mind-blowing 5.12X from here
👉 Here is how to time the top...
10/11
🎯$235,572 target
🤯Mind-blowing 5.12X from here
👉 Here is how to time the top...
10/11

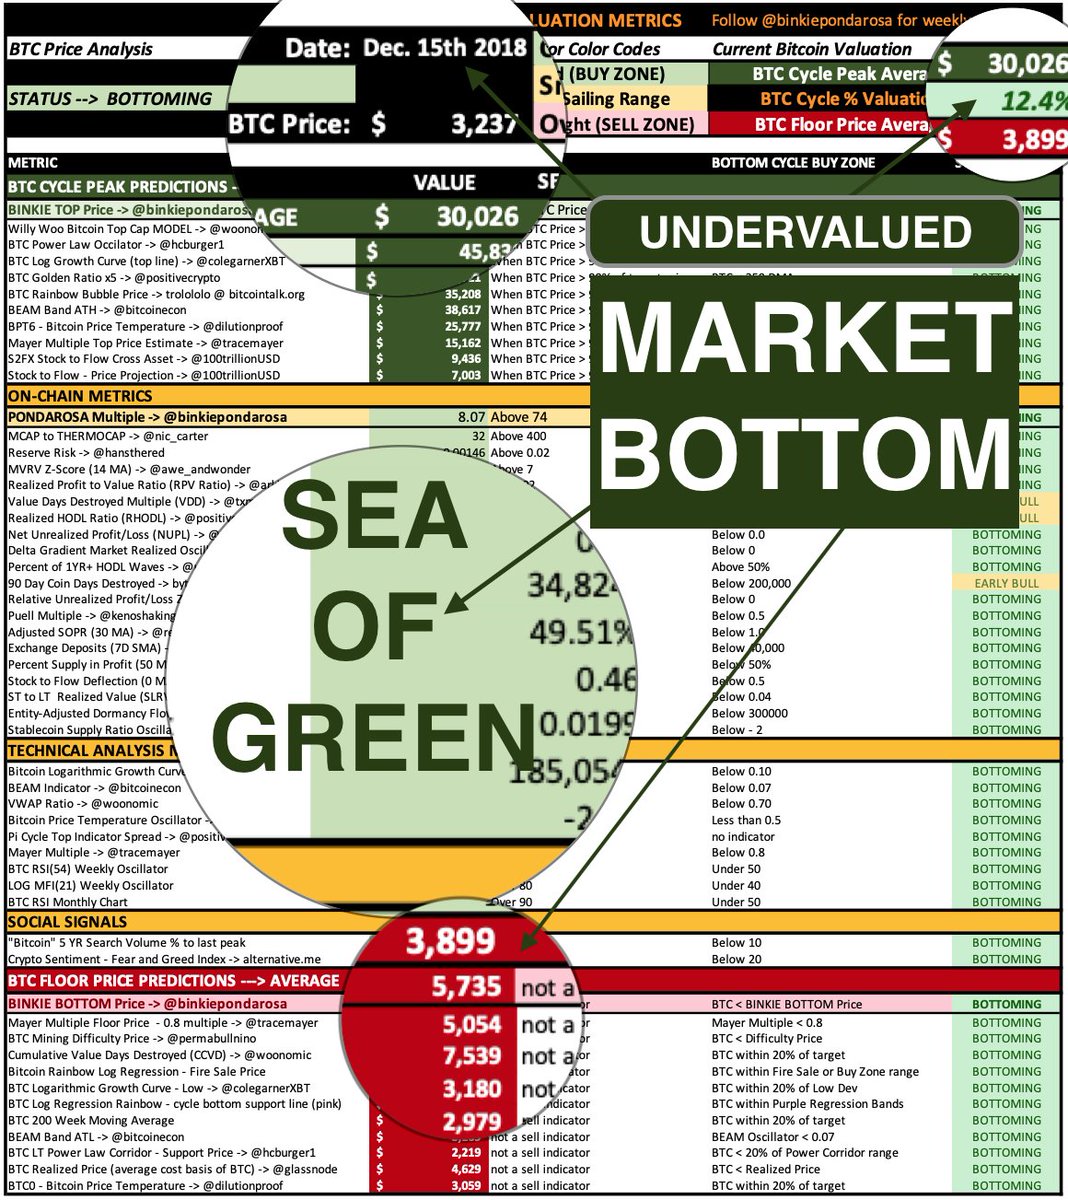
Get these price targets updated weekly + 50 #onchain metrics in 1 simple tweet.
🤗#BTC changed my life.
🛠️Grinding out this spreadsheet each week is my POW
🎁I share to give back
🙏Retweet if it can help others
👉follow me @BinkiePondarosa for a weekly cycle update
11/11
🤗#BTC changed my life.
🛠️Grinding out this spreadsheet each week is my POW
🎁I share to give back
🙏Retweet if it can help others
👉follow me @BinkiePondarosa for a weekly cycle update
11/11

• • •
Missing some Tweet in this thread? You can try to
force a refresh