If we look at the age breakdown we see a similar pattern to other places -- the big increase over the last week (red line vs. blue line) has been among young(ish) adults. I think this is largely due to greater socialising in these age groups.
Here, for example, is the plot for 25-29 year olds since October. The rate has approximately doubled in the last three days.
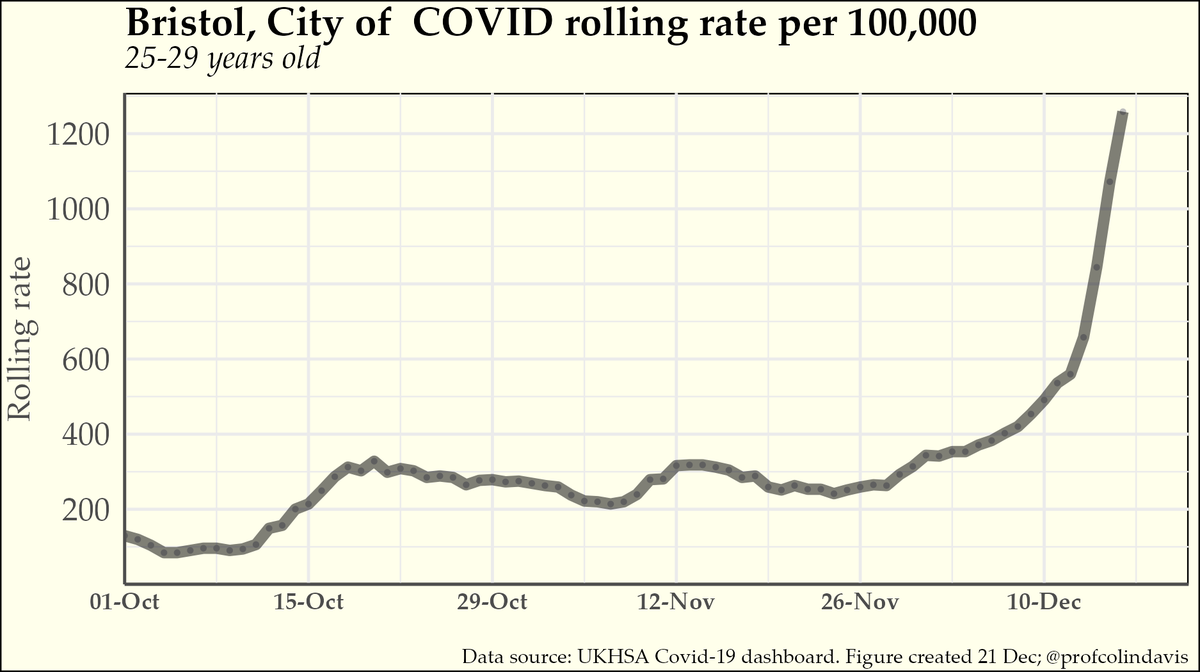
There's been no rise in the 55+ groups yet. That difference between younger and older adults could - in part - reflect a booster effect. But if so, why don't we see a similar increase in cases among unboosted (often unvaccinated) children? (That's why I think it's socialising).
Sadiq Khan declared a major incident in London when there was a surge in cases. In terms of (population-adjusted) rolling rates, Bristol is now at about the same point. Will Marvin Rees do the same? (Perhaps we'll have another consultation).
PS A correction - 15th Dec is our highest total to date, but it was actually 891 cases. Apologies.

• • •

Missing some Tweet in this thread? You can try to force a refresh
 

Keep Current with Colin Davis

Colin Davis Profile picture

Stay in touch and get notified when new unrolls are available from this author!

Read all threads

This Thread may be Removed Anytime!

PDF

Twitter may remove this content at anytime! Save it as PDF for later use!

Try unrolling a thread yourself!

how to unroll video
  1. Follow @ThreadReaderApp to mention us!

  2. From a Twitter thread mention us with a keyword "unroll"
@threadreaderapp unroll

Practice here first or read more on our help page!

More from @ProfColinDavis

21 Dec
I think the "Tory ministers vs scientists" framing is a distraction from the real clash, which isn't about science. More generally, people's beliefs about Covid are not just about evidence -- they also reflect people's motivations.

Here's my take 🧵
Only a tiny minority would (if they’re honest) claim that omicron poses no threat. The majority see that it poses a serious threat, though just how big a threat remains to be established. My focus here is on those who say, "Yes, it's cause for concern, but it'll probably be OK".
Ministers have the power to do something about this threat – but don’t want to. Rejecting the science is a more acceptable way of doing nothing than openly admitting you don’t care abt life-threatening disruptions to public services & the prospects of tens of thousands of deaths.
Read 9 tweets
13 Dec
I'm continuing to see people talking about the rate at which sequenced Omicron cases are doubling as if it's a matter of interpretation, or something that different people could reasonably disagree on. It isn’t. It’s like 2+2.
Perhaps it would be useful for me to give a short tutorial on how to calculate doubling rates? It's actually very easy, when you know how. Is anyone interested in that?
OK, looks like there is some interest. So here's a short tutorial for people who never knew how to do this, or who are a bit rusty. I suspect there are a lot of people in this category, so I hope it’ll be useful to them. (I'll deal with qualifiers at the end of this thread).
Read 43 tweets
11 Dec
I shouldn't take it personally, but I am starting to feel rather gaslit by people (including experts) talking about omicron cases doubling every 3 days (or 2.5 days). I've plotted the data against different doubling rates below -- how fast do *you* think cases are doubling? Image
The graph above said "log scale" (I forgot to change the label), but it is obviously a linear scale (thanks @UncleJo46902375 ). Here's the correctly labelled version. Image
If you'd like to check my working (please do!), here are the data (two parts):

date newCases total
2021-11-2722
2021-11-2813
2021-11-29811
2021-11-301122
2021-12-011032
2021-12-021042
2021-12-0392134
2021-12-0426160
2021-12-0586246
2021-12-0690336

(cont'd)
Read 4 tweets
6 Dec
Having another go at plotting UK omicron cases (previous attempt plotted total over time, which I decided wasn't very useful). Numbers are still sufficiently small to mean that noise in the data makes a big difference. But based on data so far, current doubling rate is 1-2 days. Image
This estimate could be too fast, if we've got better at detecting omicron over the last few days. Or it could be too conservative if it's getting harder for us to track omicron caes as numbers increase. Mix of imported and home-grown cases also unclear. So some caution required.
Updating this graph for 7th Dec. That line of best fit is still consistent with a doubling rate of 1-2 days (midpoint is 1.6 days). Things should get clearer in a couple more days. But we don't need to wait until then to introduce precautionary measures such as working from home. Image
Read 16 tweets
14 Nov
I feel a sense of deja vu, looking at Charnwood once again. It's interesting because it's one of those places where schools go back earlier than other parts of England, so it's a kind of canary in the Covid mine. Rates have grown steeply there in the last week in 5-14 year olds. Image
Although school age children have by far the highest rates in Charnwood, there is one adult age group that is catching up: 40-44 year olds. This is a familiar pattern. Image
The short thread below was the last time I looked at Charnwood. Showing typical caution in causal attribution I noted that the increase *could* just reflect "back-to-school testing". What happened subsequently suggests it wasn't.

Image
Read 6 tweets
12 Nov
Inspired by this thread, I thought I'd take a look back at some early (read: premature) assessments of the Covid situation among children following the return to school (in September and November). 🧵
I don't particularly mean to pick on @apsmunro (sorry if it seems like that). He's hardly the only optimist here -- this example is simply representative of a certain part of Covid Twitter in the first couple of weeks after schools went back in September.
Having said that, I do find it rather curious that a paediatrician would present a graph showing that many thousands of children were testing postive each day in England as cause for celebration or reassurance.
Read 14 tweets

Did Thread Reader help you today?

Support us! We are indie developers!


This site is made by just two indie developers on a laptop doing marketing, support and development! Read more about the story.

Become a Premium Member ($3/month or $30/year) and get exclusive features!

Become Premium

Too expensive? Make a small donation by buying us coffee ($5) or help with server cost ($10)

Donate via Paypal

Or Donate anonymously using crypto!

Ethereum

0xfe58350B80634f60Fa6Dc149a72b4DFbc17D341E copy

Bitcoin

3ATGMxNzCUFzxpMCHL5sWSt4DVtS8UqXpi copy

Thank you for your support!

Follow Us on Twitter!

:(