1/ ASMR: A closer look on the Balkan.

Age adjusted seasonal mortality ranking over 3 years.

Reminder: Displayed are 3 flu seasons, not calendar years.

2018: 1.7.2018-30.6.2019
2019: 1.7.2019-30.6.2020
2020: 1.7.2012-30.6.2021 ImageImage
2/ All of the Balkan countries show the spike in season 2020, so July 2020 - June 2021.

Interesting.

We may need to expand on the hypothesis laid out by @hmatejx to understand this as Croatia really isn't known for having done hard lockdowns like the Slovenian neighbours. Image
3/ This is how 2021 (weeks 1-43) currently ranks. Image
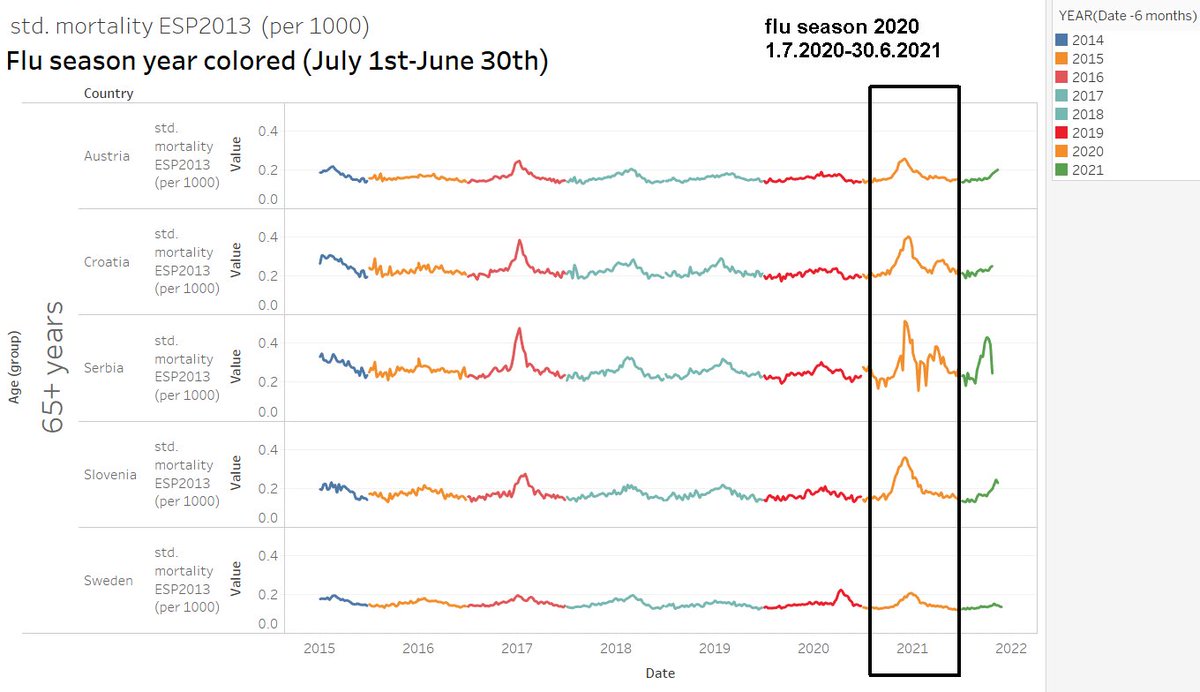
4/ A look on the raw data. We can see here, how all of the Balkan countries and Austria were hit (root cause tbd.) in the 2nd winter season. ImageImage
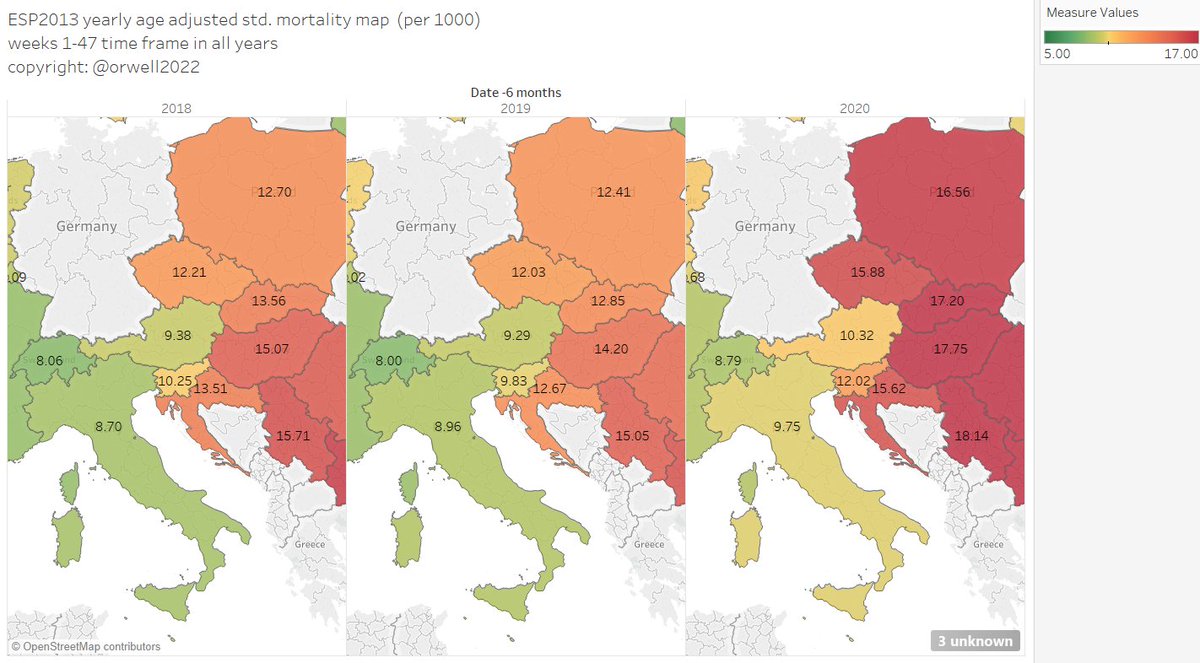
5/ Now adjusted seasonal ASMR mortality maps over 3 years.

Displayed are 3 flu seasons.

2018: 1.7.2018-30.6.2019
2019: 1.7.2019-30.6.2020
2020: 1.7.2012-30.6.2021

We need to understand this. Ideas?

Smoking? Habits? Genetics? Or just GDP per capita? Image
6/ A closer look to the Slavic countries on a relative season to season change. This level of Y2Y ASMR change is significant. Image
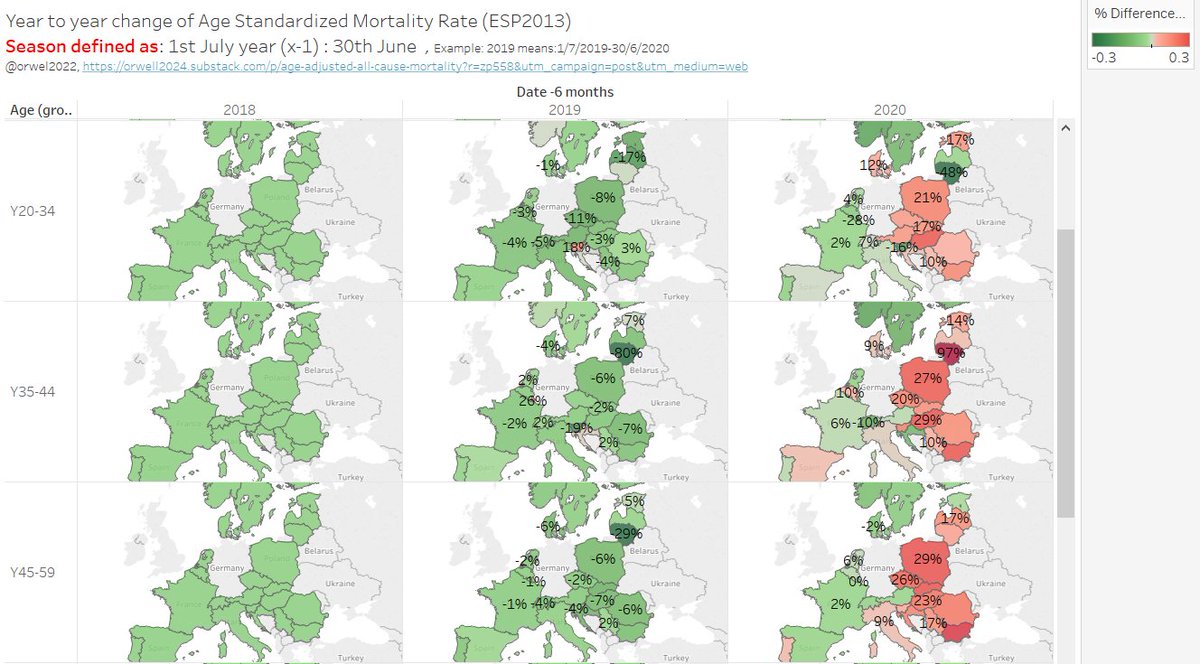
7/ East Europe by age group now.

This is interesting. The excess goes through all age groups it seems.

Note: red colors start above +7%. ImageImage

• • •

Missing some Tweet in this thread? You can try to force a refresh
 

Keep Current with Orwell2024

Orwell2024 Profile picture

Stay in touch and get notified when new unrolls are available from this author!

Read all threads

This Thread may be Removed Anytime!

PDF

Twitter may remove this content at anytime! Save it as PDF for later use!

Try unrolling a thread yourself!

how to unroll video
  1. Follow @ThreadReaderApp to mention us!

  2. From a Twitter thread mention us with a keyword "unroll"
@threadreaderapp unroll

Practice here first or read more on our help page!

More from @orwell2022

24 Dec
1/ Netherlands ASMR mortality update - now up to week 47 (end November).

Left: perception and panic (unadjusted crude mortality)

Right: Age Standardized Mortality (reality)
2/ ASMR By age group and sex. Problem or not?

All of the 2021 apparent excess in tweet 1 on the left is the illusion of demographics and mortality in the 75+ age population which is getting bigger and bigger every year.

Standardized, the statistical illusion disappears.
3/ Summary:
Read 4 tweets
22 Dec
1/ The main stream media @TheEconomist and also @OurWorldInData continue their "Our Age Confounded Useless Data" game combined with excess metrics which mislead.

2/ I don't have 26M followers @TheEconomist, but I do know that using Age Standardized Mortality Rates is the only meaningful metric unless you want to show that Nigeria with a low excess is better than living in Italy (life expectancy 82 years).

But here an example: Denmark
3/ The @TheEconomist is here suggesting that Denmark with an 46 week ASMR 2021 of 8.48 is better than Norway at 6.66.

30% higher ASMR is a bad.

Having a lot of deaths at a stable baseline is better than having variance at ultra low baselines?

What does @redouad think?
Read 6 tweets
22 Dec
1/ I mirror his words back now @dimgrr

The OWID website is one of the worst. After almost a 2 years, there still aren't any age de-confounded ASMR, and the coverage time series only include misleading aggregated figures. OWID delivers one Simpson's paradox after another.
2/ Here some input for @redouad. OWID likes to fear porn with unadjusted death figures. Even better with cumulated "total deaths" (sounds scary right?) over several years.

Better method:

orwell2024.substack.com/p/age-adjusted…
3/ Doing it correctly at OWID, you would be able to understand what is happening Mr. Edouard.

Instead, you troll Netherlands and @rivm while having such a bad service yourself.

Change the name OWID to OACUD:

"Our Age Confounded Useless Data".

Here de-confounded👇
Read 17 tweets
21 Dec
1/ A Sunday quiz game: find the deadliest pandemic years 2020 and 2021.

Age standardized mortality for the weeks 1-46 is shown below over 21 years.

Rule: you have to score both years correct.

Should be easy: just pick the highest ones...or not? Image
2/ Austria, same game, same rules. @freiheit_ruft Image
3/ Sweden, same game, same rules. Note: the years are all always random in all pictures. With a different seed when flipping the coins. Image
Read 6 tweets
20 Dec
1/ NL, AUT, SWE, NO, CH age adjusted mortality update.

I have added data up to week 47 now (28th November).

Left column: crude mortality (normalized to total population).
Right column: ASMR using NL2011 std. population.

AUT and NL go up, not NO, CH, SWE.
2/ The mortality increase in NL and AUT is not related to vaxx. The vaxx is at the same time not visible as lifesaving in all cause as C19 is not the driving parameter, neither is the vaxx.
We likely see the price to pay for permanent lockdowns, social isolation, fear, etc.
3/ Let's dig deeper than AMSR: now we plot mortality by age bin population. This is more precise in order to understand what is going on.

No surprise, the old are dying. Do people not know this? And are we now "bin counting" 90+ people to make lockdown panic? Stop this please.
Read 16 tweets
19 Dec
El Gato with a time differential approach on VE.

Maybe we are moving closer towards calling our bets @luigi_warren ?

More solid data is just a matter of time. Then we will see if it’s real or an statistical artefact.

So is👇real or not…?

Interesting early data….
Read 4 tweets

Did Thread Reader help you today?

Support us! We are indie developers!


This site is made by just two indie developers on a laptop doing marketing, support and development! Read more about the story.

Become a Premium Member ($3/month or $30/year) and get exclusive features!

Become Premium

Too expensive? Make a small donation by buying us coffee ($5) or help with server cost ($10)

Donate via Paypal

Or Donate anonymously using crypto!

Ethereum

0xfe58350B80634f60Fa6Dc149a72b4DFbc17D341E copy

Bitcoin

3ATGMxNzCUFzxpMCHL5sWSt4DVtS8UqXpi copy

Thank you for your support!

Follow Us on Twitter!

:(