In Python, you can visualize images with the Plotly IMshow function.
🧵[1/8]
sharpsightlabs.com/blog/plotly-im…
#Python #pythonlearning #datascience #datavisualization
🧵[1/8]
sharpsightlabs.com/blog/plotly-im…
#Python #pythonlearning #datascience #datavisualization
[2/8]
You can use Plotly IMshow for a few uses.
You can use it to plot heatmaps ...
But you can also use it to plot images.
You can use Plotly IMshow for a few uses.
You can use it to plot heatmaps ...
But you can also use it to plot images.
[3/8]
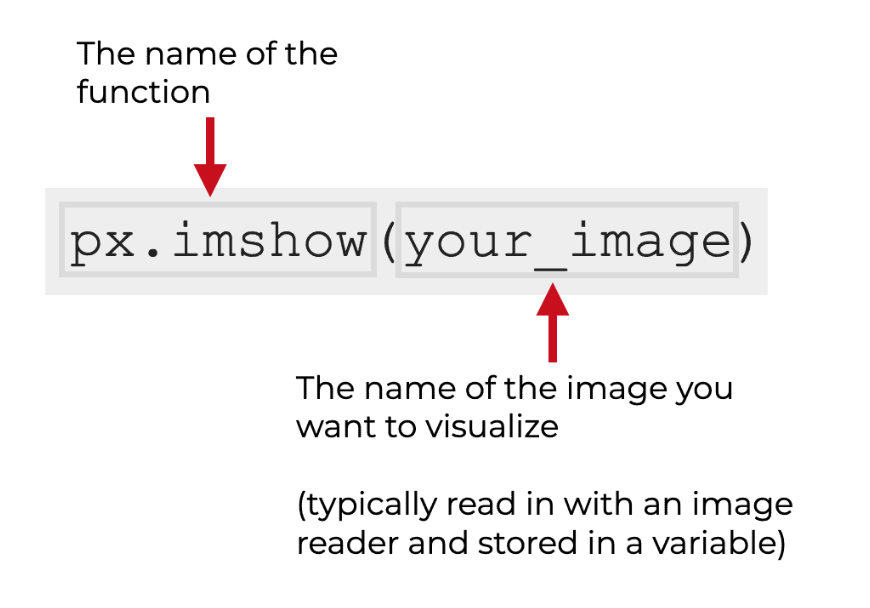
The syntax for Plotly IMshow is pretty simple.
You call the function as px.imshow and then provide the name of the image file you want to visualize.
(This assumes you've imported Plotly express as px)
#Python #pythoncode
The syntax for Plotly IMshow is pretty simple.
You call the function as px.imshow and then provide the name of the image file you want to visualize.
(This assumes you've imported Plotly express as px)
#Python #pythoncode
[4/8]
Typically, when you plot an image this way ...
The input to px.imshow will be a .jpg or .png file ...
But You'll need to read the file in first using Plotly imread
Typically, when you plot an image this way ...
The input to px.imshow will be a .jpg or .png file ...
But You'll need to read the file in first using Plotly imread

[5/8]
You can learn more about Plotly IMread here:
sharpsightlabs.com/blog/skimage-i…
#Python #learnpython
You can learn more about Plotly IMread here:
sharpsightlabs.com/blog/skimage-i…
#Python #learnpython
[6/8]
Here's a quick example of how to use Plotly imshow.
We'll read in the file with IMRead ...
And then visualize with IMshow
#Python #pythoncode #pythonlearning #datascience
Here's a quick example of how to use Plotly imshow.
We'll read in the file with IMRead ...
And then visualize with IMshow
#Python #pythoncode #pythonlearning #datascience


[7/8]
Plotly IMRead is pretty easy to use, and it's useful if you're working with image data.
(For example, some machine learning systems operate on image data)
#Python #pythonlearning #machinelearning
Plotly IMRead is pretty easy to use, and it's useful if you're working with image data.
(For example, some machine learning systems operate on image data)
#Python #pythonlearning #machinelearning
[8/8]
If you want to learn more about data science and data visualization, then follow me here: @Josh_Ebner
Every day, I post tutorials and threads about data science and machine learning in Python and R.
#datascience #machinelearning #Python #rstats
If you want to learn more about data science and data visualization, then follow me here: @Josh_Ebner
Every day, I post tutorials and threads about data science and machine learning in Python and R.
#datascience #machinelearning #Python #rstats
• • •
Missing some Tweet in this thread? You can try to
force a refresh