Merging two or more datasets is extremely important in data science.
Here's a quick thread that covers the basics of data merges in Python.
🧵[1/19]
#Python #datascience #DataAnalytics
Here's a quick thread that covers the basics of data merges in Python.
🧵[1/19]
#Python #datascience #DataAnalytics


[2/19]
In Python ...
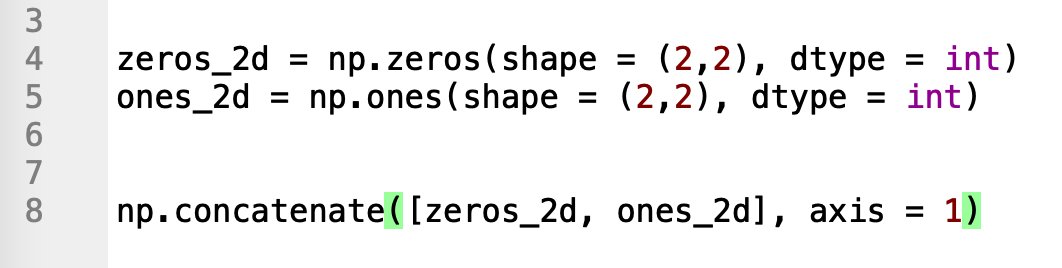
You can combine two Pandas dataframes using the "merge" function.
You can also use the "join" function (which defaults to joining on the index)
#Python #datascience #DataAnalytics
In Python ...
You can combine two Pandas dataframes using the "merge" function.
You can also use the "join" function (which defaults to joining on the index)
#Python #datascience #DataAnalytics
[3/19]
When you merge dataframes, you'll typically have a so-called "key" variable.
This is the variable upon which you'll join the dataframes.
#Python #datascience
When you merge dataframes, you'll typically have a so-called "key" variable.
This is the variable upon which you'll join the dataframes.
#Python #datascience
[4/19]
Typically, the "key" is a variable with unique values that can identify a particular record.
You can think of this as an ID variable (although if there's not a single unique variable, it's possible to merge data on multiple variables)
#Python #datascience #DataAnalytics
Typically, the "key" is a variable with unique values that can identify a particular record.
You can think of this as an ID variable (although if there's not a single unique variable, it's possible to merge data on multiple variables)
#Python #datascience #DataAnalytics
[5/19]
So in the example above, we're merging the two dataframes on the employee_id variable.
This variable exists in both dataframes, and is unique in both dataframes.
So in the example above, we're merging the two dataframes on the employee_id variable.
This variable exists in both dataframes, and is unique in both dataframes.
[6/19]
If you look carefully, you'll notice that there are several rows in both dataframes where there's a match for employee_id
101 exists in both dataframes
102 exists in both dataframes
103 exists in both dataframes
104 exists in both dataframes
If you look carefully, you'll notice that there are several rows in both dataframes where there's a match for employee_id
101 exists in both dataframes
102 exists in both dataframes
103 exists in both dataframes
104 exists in both dataframes
[7/19]
But there are some values of employee_id that only exist in one dataframe or the other.
For example ...
900 only exists in one dataframe
901 exists in the other dataframe
But there are some values of employee_id that only exist in one dataframe or the other.
For example ...
900 only exists in one dataframe
901 exists in the other dataframe
[8/19]
When we do a 'merge' of two dataframes in Python, we use the 'on=' parameter to specify the key variable ... the variable where we're looking for matching values.
If there's a match, then the rows are typically joined up and put in the output dataframe.
When we do a 'merge' of two dataframes in Python, we use the 'on=' parameter to specify the key variable ... the variable where we're looking for matching values.
If there's a match, then the rows are typically joined up and put in the output dataframe.
[9/19]
But the question is how to deal with the non-matching rows.
There are actually different time of merges (AKA, joins) that deal with non-matching rows differently.
But the question is how to deal with the non-matching rows.
There are actually different time of merges (AKA, joins) that deal with non-matching rows differently.
[10/19]
An inner merge keeps only the rows that match exactly for the 'on' variable
A left merge keeps everything in the "left" dataframe (the dataframe that's syntactically on the left hand side), and adds data from matching data on the right.
#datascience #DataAnalytics
An inner merge keeps only the rows that match exactly for the 'on' variable
A left merge keeps everything in the "left" dataframe (the dataframe that's syntactically on the left hand side), and adds data from matching data on the right.
#datascience #DataAnalytics


[11/19]
There are actually other types of merges/joins, but they are less commonly used.
If you're just starting out, I recommend that you learn how to do inner merges and left merges first, since those are the most common.
There are actually other types of merges/joins, but they are less commonly used.
If you're just starting out, I recommend that you learn how to do inner merges and left merges first, since those are the most common.
[12/19]
As always, the 80/20 rule applies.
As always, the 80/20 rule applies.
[13/19]
Merges and data joins are very important in data science.
Merges and data joins are very important in data science.
[14/19]
Typically, when you work on a project, the data you need will be scattered across multiple sources.
Typically, when you work on a project, the data you need will be scattered across multiple sources.
[15/19]
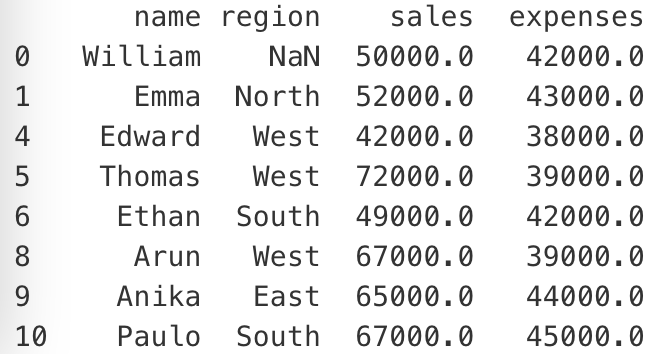
Part of the data cleaning and data wrangling phase of work is cleaning up the individual datasets, and *merging* them together into a final dataframe that's ready for analysis
#datascience #DataAnalytics
Part of the data cleaning and data wrangling phase of work is cleaning up the individual datasets, and *merging* them together into a final dataframe that's ready for analysis
#datascience #DataAnalytics
[16/19]
Because you'll often need to combine multiple datasets before you work on a project, you really need to understand merges and joins.
#datascience #DataAnalytics
Because you'll often need to combine multiple datasets before you work on a project, you really need to understand merges and joins.
#datascience #DataAnalytics
[17/19]
To be clear, I've glossed over a lot of details in this thread.
Things like joining on the index, multiple key variables, alternative merge types, etc.
To be clear, I've glossed over a lot of details in this thread.
Things like joining on the index, multiple key variables, alternative merge types, etc.
[18/19]
But this thread should give you some of the basics of how to merge two datasets in Python.
But this thread should give you some of the basics of how to merge two datasets in Python.
[19/19]
If you want to learn more about data science and data wrangling, then follow me here: @Josh_Ebner
Every day, I post threads and tutorials about data science and machine learning in Python and R.
#Python #rstats #datascience #machinelearning #dataanalytics
If you want to learn more about data science and data wrangling, then follow me here: @Josh_Ebner
Every day, I post threads and tutorials about data science and machine learning in Python and R.
#Python #rstats #datascience #machinelearning #dataanalytics
• • •
Missing some Tweet in this thread? You can try to
force a refresh