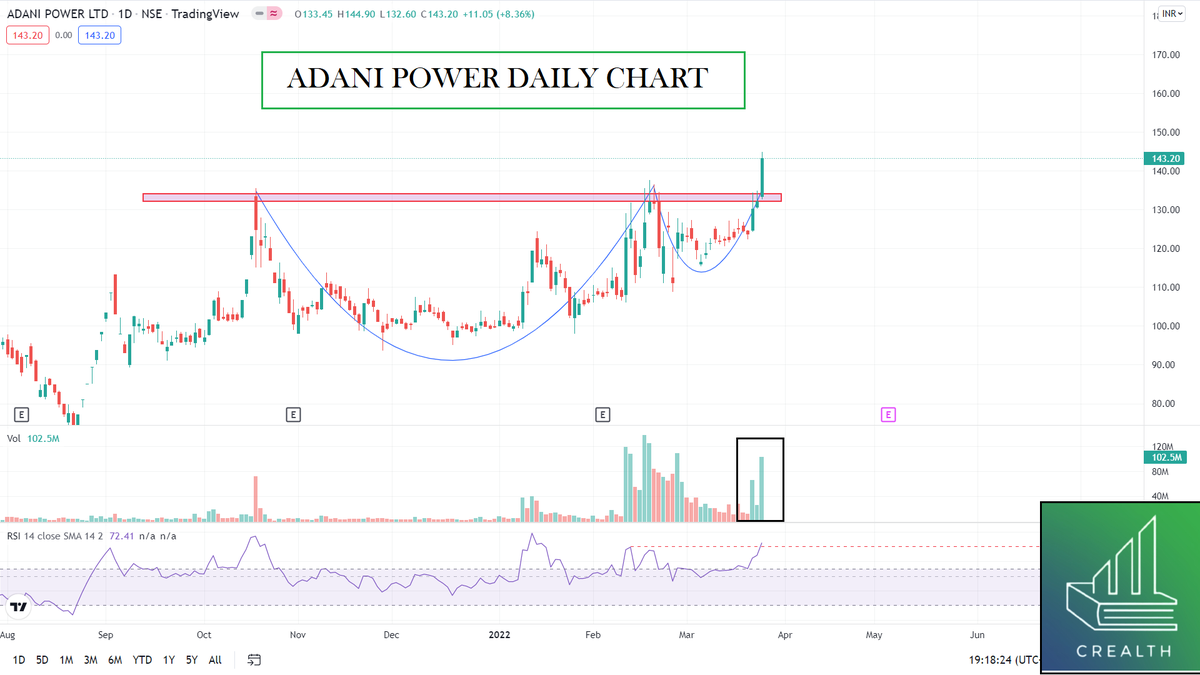
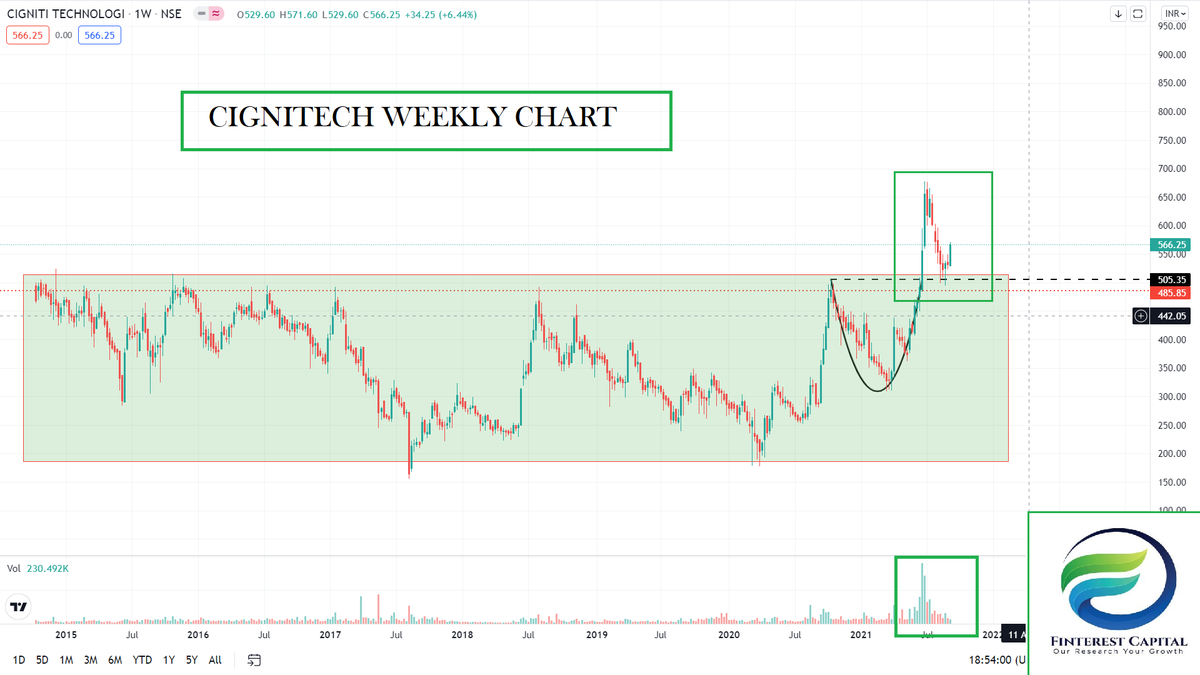
An educational #Thread on how 1 can identify "Freakout"(Fake Breakout) explained with practical e.g's so that every1 can understand.
Identifying Breakout is not a big challenge but exiting it at the right time if it "fails" with minor loss is imp. which 90% people don't do.
1/n
Identifying Breakout is not a big challenge but exiting it at the right time if it "fails" with minor loss is imp. which 90% people don't do.
1/n

1st lets learn how to judge that the Breakout is not sustaining & time to exit the trade has come for once.
With digital content available identifying #Stocks breaking resistance is not a big task but exiting these trades timely if they go against us is the most imp. thing.
2/n
With digital content available identifying #Stocks breaking resistance is not a big task but exiting these trades timely if they go against us is the most imp. thing.
2/n
Let's understand the abv with recent e.g of USDINR. It gave a breakout abv 75.6 after 8 months. Though we saw a mild upmove after that but it drastically failed& cmp is 74.5.
Now if some1 bought on breakout then usually most will hold it till now or exit at cmp in distress.
3/n
Now if some1 bought on breakout then usually most will hold it till now or exit at cmp in distress.
3/n

If any of the following 2 criteria's match then 1 should exit the trade.
* Stock makes a LowerLow, LowerHigh consecutively for 2 days.
* It breaks the low of breakout candle & sustains for 1 day.
USDINR made a LL,LH for 2 days on 17th,20th Dec so exit was at 75.73 on 20th.
4/n
* Stock makes a LowerLow, LowerHigh consecutively for 2 days.
* It breaks the low of breakout candle & sustains for 1 day.
USDINR made a LL,LH for 2 days on 17th,20th Dec so exit was at 75.73 on 20th.
4/n

Similar e.g is Bharti which gave a ATH, consolidation breakout on 23rd nov abv 745. The Breakout couldn't sustain & cmp is 684.
Ideal exit was on 29th Nov at 739 when it broke the breakout candle low of 733 & sustained below it on 29th. So it fulfilled 2nd criteria of exit.
5/n
Ideal exit was on 29th Nov at 739 when it broke the breakout candle low of 733 & sustained below it on 29th. So it fulfilled 2nd criteria of exit.
5/n

The same theory is valid even for breakdowns which can be seen in Cipla where it broke 8 months tight range on 17th Dec & on 18th broke the breakdown high.
Hence it met the 2nd criteria of sustaining abv Breakdown high & immediately 1 should have exited shorts, built longs.
6/n
Hence it met the 2nd criteria of sustaining abv Breakdown high & immediately 1 should have exited shorts, built longs.
6/n

The most recent e.g 1 can see is Dow jones which gave a breakout on 29th. However on friday it has made a LH, LL formation which isn't good & if it again makes it on Mon then 1 should exit longs taken on the basis of the breakout on thurs.
So let's watch next week closely.
7/n
So let's watch next week closely.
7/n

"No Capital No Capital Markets" - The above thread is dedicated to same.
1 can always renter such trades but exiting them timely is very imp. & my personal experience says that deciding exiting trades criteria, time is where 90% fail.
THE END.
Feedbacks, views are appreciated.
1 can always renter such trades but exiting them timely is very imp. & my personal experience says that deciding exiting trades criteria, time is where 90% fail.
THE END.
Feedbacks, views are appreciated.
• • •
Missing some Tweet in this thread? You can try to
force a refresh


