1/5
Narrative is US cases will peak any day following South Africa pattern.
Keep in mind:
* South Africa is only 30% vaxxed (US 63%)
* It's young with few restrictions
* So, everyone "breathed on each other" cases went up 100x in 30 days and then peaked.
Narrative is US cases will peak any day following South Africa pattern.
Keep in mind:
* South Africa is only 30% vaxxed (US 63%)
* It's young with few restrictions
* So, everyone "breathed on each other" cases went up 100x in 30 days and then peaked.
https://twitter.com/fvan1/status/1478904543261990914

2/5
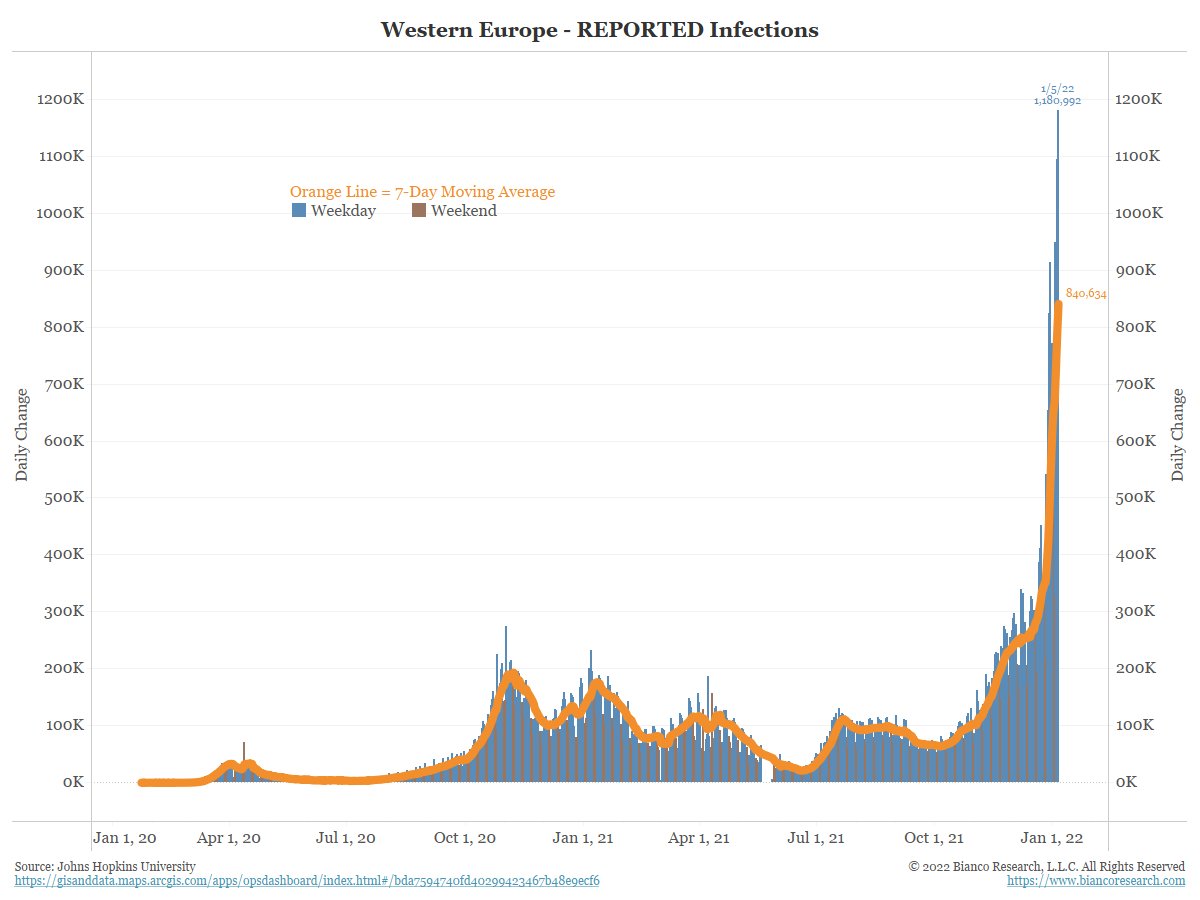
Why isn't Europe a better model for the US?
They are trying to prevent spread with restrictions/lockdowns (Dutch). So, they are dragging it out and made another new high yesterday.
EU is not willing to go 100x in 30 days like SA, so they are taking a longer time to peak.
Why isn't Europe a better model for the US?
They are trying to prevent spread with restrictions/lockdowns (Dutch). So, they are dragging it out and made another new high yesterday.
EU is not willing to go 100x in 30 days like SA, so they are taking a longer time to peak.

3/5
If the US was indeed following South Africa and going to peak any day, our 7-day positive avg would be about 3M now, not ~600k.
We are trying to slow it down, and it is working!! EU leads the US by 6 weeks. If the EU peaks today, the US peaks in 2H of Feb at the earliest.
If the US was indeed following South Africa and going to peak any day, our 7-day positive avg would be about 3M now, not ~600k.
We are trying to slow it down, and it is working!! EU leads the US by 6 weeks. If the EU peaks today, the US peaks in 2H of Feb at the earliest.

4/5
Is the EU/US just too big (population) to peak without the world peaking?
So far, the world is not peaking
Is the EU/US just too big (population) to peak without the world peaking?
So far, the world is not peaking

5/5
My interest is economic, when is the massive loss of workdays going to peak.
How massive? In the last 10 days nearly 2.8% of the US workforce tested positive and it most likely out.
This will contribute to lost production pushing up prices (inflation). See the airlines.
My interest is economic, when is the massive loss of workdays going to peak.
How massive? In the last 10 days nearly 2.8% of the US workforce tested positive and it most likely out.
This will contribute to lost production pushing up prices (inflation). See the airlines.

• • •
Missing some Tweet in this thread? You can try to
force a refresh


