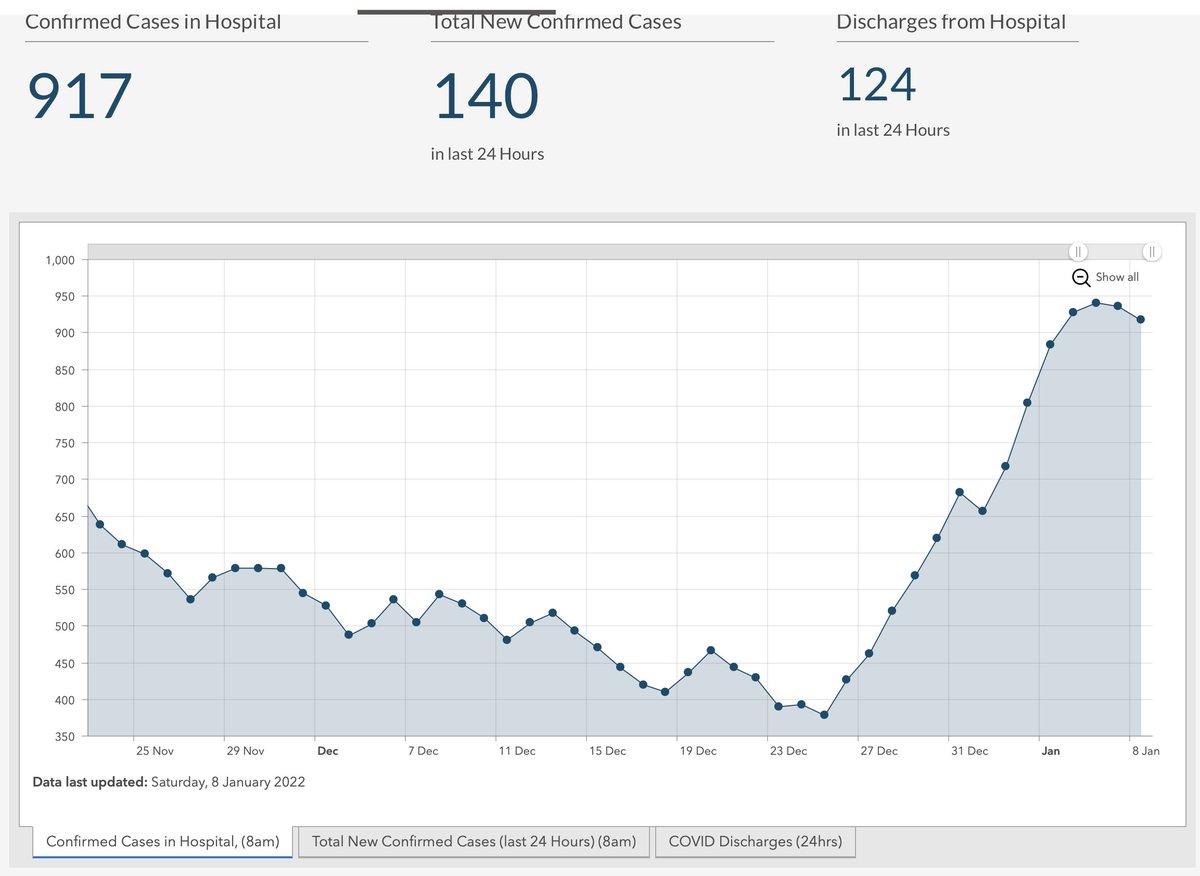
Common Sunday increase in #Covid19Ireland hospital cases due to delayed discharges at weekend with 984 in Hospital 137% last Sunday - that rate has slowed & this day last year there were 1,285 in hospital. Discharges typically catch up Tuesdays so tomorrow may see over 1,000 /1
Today last year there were a similar number of new hospital cases (134) but we were in the middle of a rapid escalation of occupancy due to xmas intergenerational mixing - so far this year is different because of higher discharge rate, probably vaccine driven /2
Again due to vaccination the proportion of cases going to hospital is a tiny fraction of last year. New hospital cases are 0.83% cases in week to 6 days previous - just as well as there were 123k cases detected that week & probably as many again that could not access testing /3
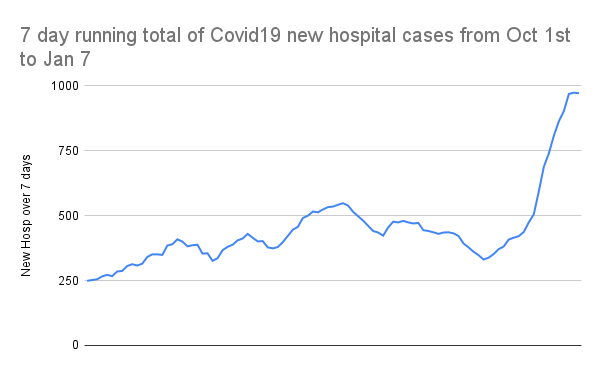
In contrast to same days last year the number of cases going to hospital in a week has slowed. 1022 new hospital cases this week is 126% previous week. These hospital cases would mostly be from infections that took place from 21st Dec to 27th Dec so now include Xmas & Stephens/4
Plotting todays hospital cases as a black dot on my NPHET Omicron tracker we can see that in the last week we shifted from being on the lower end of the worst 3rd to slightly above the middle curves which peak under 1500. I suspect that may turn out too optimistic though /5
I say that because the north has a significant increase in cases in older people late this week. The south has not yet released age data which is as recent but presuming its similar that will increase hospitalisations & length of stay next weekend so may push us well over 1500/6
The second key factor looking at last years hospital numbers is that flattening that takes place in a few days is because of the New Year lockdown. Obviously that doesn't apply this year although there will presumably be some impact of a return to normal mixing /7
This is the big difficulty in knowing what will happen - PCR testing has essentially broken down with very large numbers unable to get timely tests & many giving up. So daily case numbers tell us little apart from how much testing was done (and 52% will be positive) /8
As long as infections increase then hospitalisations will increase 2 weeks later. Cases no longer give an accurate picture of whether infections are increasing or decreasing & won't until positivity comes back down again. We won't know where hospital peak will be until after /9
Thankfully these trends are continuing into ICU occupancy with 83 ICU is 95% last Sunday however deaths in ICU remain the major reason why we don't see a rise week on week /10
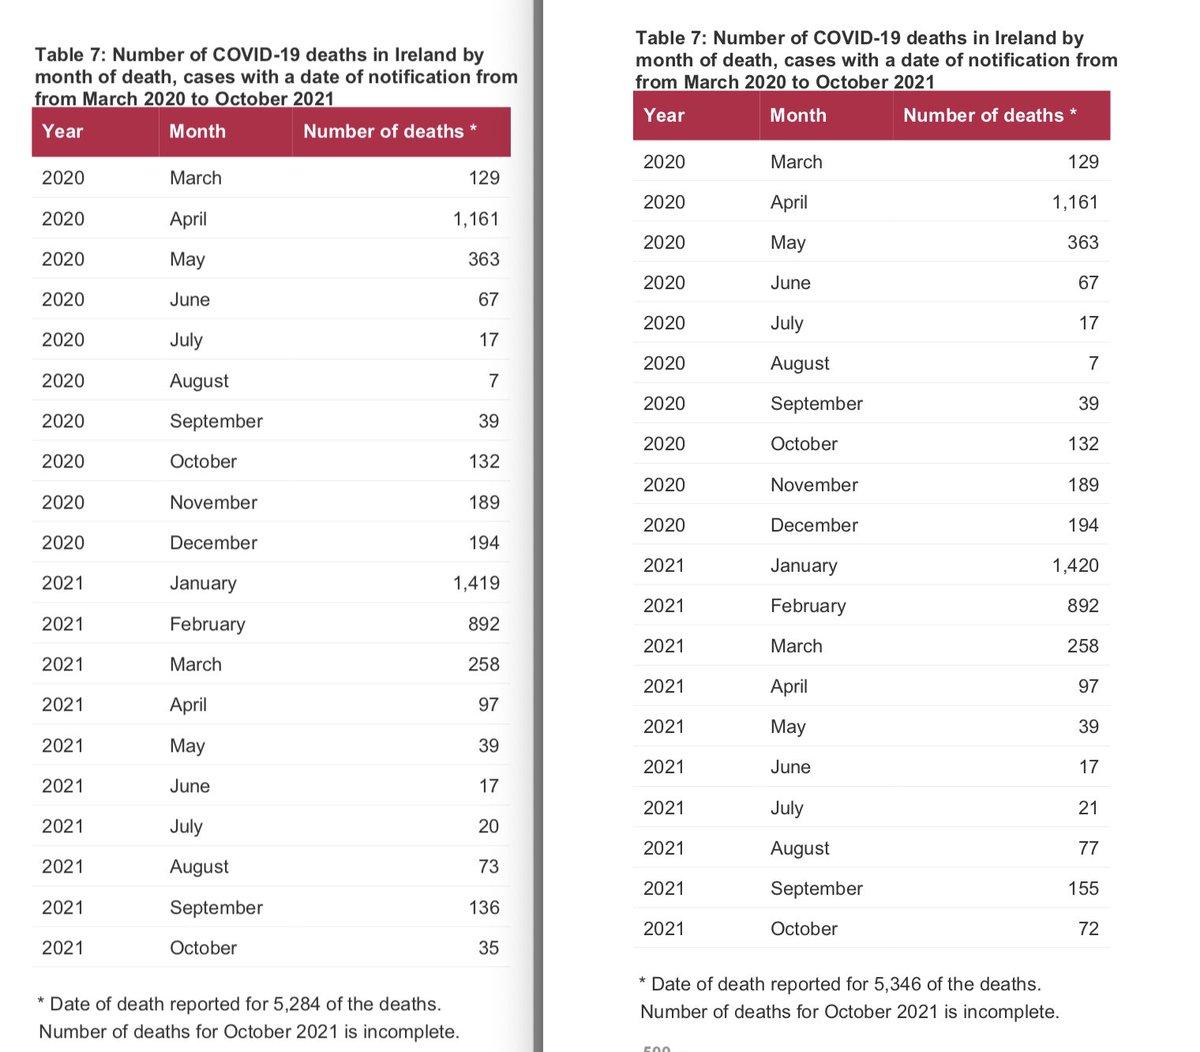
The contrast with this day last year is very striking, now was the middle of a consistent period where ICU numbers rose every single day, there were 121 there today last year 146% of the current occupancy /11
44 new ICU admissions this week is 102% previous - new ICU admissions per week have hardly risen at all in the Omicron period which has seen infections at the very least doubling every week /12
New ICU in week is 0.05% cases in week 10 days earlier, 4.52% new hospital cases in week 3 days earlier. Both of these are fractions of the proportions in October before the boosting program reached out but have also quickly halved in the Omicron period /13
Adding todays ICU occupancy as black dot onto my NPHET Omicron ICU demand tracker its now very clear that the guess at effectiveness of boosters & the less frequent severity of Omicron were pessimistic & we are seeing much better outcomes than expected. Preferable to last Jan/14
What exactly the percentage cases changes mean right now is anyone's guess & it will be interesting to see positivity figures when released tomorrow but
21,384 cases today is 125% last Sunday
149,193 cases this week is 132% previous

• • •

Missing some Tweet in this thread? You can try to force a refresh
 

Keep Current with Andrew Flood 👨🏻‍💻📝🕺

Andrew Flood 👨🏻‍💻📝🕺 Profile picture

Stay in touch and get notified when new unrolls are available from this author!

Read all threads

This Thread may be Removed Anytime!

PDF

Twitter may remove this content at anytime! Save it as PDF for later use!

Try unrolling a thread yourself!

how to unroll video
  1. Follow @ThreadReaderApp to mention us!

  2. From a Twitter thread mention us with a keyword "unroll"
@threadreaderapp unroll

Practice here first or read more on our help page!

More from @andrewflood

8 Jan
Actual #Covid19Ireland ICU occupancy added as a black dot onto NPHETs mid December scenarios for Omicron - if anything we have more cases than expected so ICU being this far below expected is remarkable & very good news indeed - see thread Image
This tweet is doing number so added context
1. Cases appear to me to be at the worst end is scenarios but we lack capacity to detect that many
2. Hospitalisations until 3 days ago we’re heading for upper 1/3 of worst outcomes
… /2
…My guess would be vaccination is proving to be much more effective against severe outcomes with Omicron than anticipated but I’m still nervous about a surge in older grps. A very good thing as those ICU demand scenarios were for far more ICUs than we have at the worst 1/2
Read 4 tweets
8 Jan
Todays 917 #COVID19Ireland hospital cases are 140% last Saturday but 2nd day of a row of falling numbers. I don't want to prematurely call that a peak, it will rise tomorrow, but it is very good news indeed which I'll explain in detail /1 Image
Looking at last years hospital graph makes it clear we are on a very different trajectory. Today had 1153 in hospital and was the first 1/3 of several days of rapidly rising hospital cases as a consequence of xmas intergenerational mixing - we are not seeing that /2 Image
We have seen a period of rapidly rising new hospital cases but they are no longer doubling despite cases more than doubling in the week 6 days back, 1007 new hospital cases this week is 136% previous rather than 200%+ /3 Image
Read 19 tweets
7 Jan
936 #Covid19Ireland hospital cases today Jan7 is 137% last Friday but for the 1st time fewer than this day last year which had 1022. There were more admissions 161 this year V 131 last year but shorter lengths of stay mean numbers in hospital are now less with 3 day plateau/1 Image
972 new hospital cases this week is 141% previous but after a long period of every day increase this to has plateaued over last 3 days - too early to call a trend but certainly welcome in comparison with the alternative which had us heading for 1700 is hospital by Thursday /2 Image
Underlying this is a fall in the proportion of cases going to hospital, New hospital cases in week are 0.91% cases, 1st time that's fallen under 1% and for periods in recent months it was four times that rate (we'd have 4,000 in hospital now at that mid October rate) /3 Image
Read 13 tweets
21 Oct 21
Looking in details at 63 #Covid19Ireland deaths added week shows a larger proportion of younger ages, larger proportion at home and all but one in recent months from comparison with last weeks
Under 25 +2
25-34 +1
35-44 +1
45-54 NC
55-64 +4
65-74 +16
75-84 +15
85plus +24
/1
1 January 2021, 25 added to months covered by July NPHET scenarios - some commentators prematurely thought we had come further under deaths scn than was likely because they were not allowing for report lag
Jan+1
July+1
Aug+4
Sep+19
Oct+37 (Of which 21 were prior to this week)/2
The 10 occurring at home is 4 times the rate of the pandemic overall which along with the younger ages might indicate C19 triggered heart attacks?

Settings
Hospital +25
Res Institution +20
Home +10
Unknown +8

Outbreak linked
Nursing home +22
Hospital +4
Community Hos +1
/3
Read 15 tweets
20 Oct 21
Big surge in #Covid19Ireland ICU admissions today which TBH already throughs the push ahead with reopening into doubt. Highest occupancy since 19th March
86 ICU is 125% last Weds
49 ICU admissions this week is 153% previous
ICU admissions are 13% NHC, 0.5% cases /1
There was a lot of (strange) commentary that treated the August NPHET scenarios as missed targets & so is now wondering why healthcare can't cope now. Better to understand them as avoided fears that would have caused enormous disruption - which we are now heading towards /2
There appear to have been two deaths as only 12 additional occupancy but that would have filled all the available ICU beds yesterday which presumably means surge capacity will be activated by taking operating theatres out of use - so a lot of cancelled other healthcare /3
Read 5 tweets
20 Oct 21
First time I’ve seen this very useful table from near the start of the pandemic which assigns a score to what’s essentially the housing crisis contribution to the pandemic - note Swedens position at the bottom of the table while we are 3rd worst at top
And breaking down some of the factors that make up that housing crisis score. Given the huge role of household transmission the advantage to having a lot of single occupier households where there is nobody else to infect is self evident in making it easier to control
Going back to this table people have been asking why Denmark, Finland, Germany & Sweden have lower cases with much open. Those are the four least effected by ‘housing crisis’ overcrowding conditions as measured here. Norway not listed but also would be low on scale
Read 5 tweets

Did Thread Reader help you today?

Support us! We are indie developers!


This site is made by just two indie developers on a laptop doing marketing, support and development! Read more about the story.

Become a Premium Member ($3/month or $30/year) and get exclusive features!

Become Premium

Too expensive? Make a small donation by buying us coffee ($5) or help with server cost ($10)

Donate via Paypal

Or Donate anonymously using crypto!

Ethereum

0xfe58350B80634f60Fa6Dc149a72b4DFbc17D341E copy

Bitcoin

3ATGMxNzCUFzxpMCHL5sWSt4DVtS8UqXpi copy

Thank you for your support!

Follow Us on Twitter!

:(