About a year ago Bristol began its first Citizens' Assembly, held over four weekends.

They came up with 17 (near unanimous) recommendations on how to create a better future for all in Bristol.

democracy.bristol.gov.uk/documents/s615…

Have any of these recommendations been implemented yet?
Thanks to @TRESAcic for pointing me to this document (dated 18 January 2022!) democracy.bristol.gov.uk/documents/s686…
Of 82 actions recommended by the Assembly, it lists 14 Actions that have been agreed in principle (subject to Cabinet/budget approval), 20 Actions being taken forward "in part", and 21 Actions agreed in principle but "delivered by proxy or alternative activity".
Many of the 14 actions agreed seem a bit vague (not so-called SMART actions).

For example, "Engage directly and specifically with the transport issues faced by children and young adults in education, many of whom are feeling forgotten about ..."

How to tell if this is done?
The actions that are being taken forward in part show a lack of ambition. For example, the Assembly recommended that Bristol should "Demonstrate the benefits of liveable neighbourhoods by implementing five pilot schemes in the most deprived neighbourhoods in place by end of 2021"
Council plans to respond as follows:

"Outcome: The council has begun delivery of a pilot Liveable Neighbourhood in East Bristol with plans
for a second pilot area to be delivered by 2024."

Two pilots by 2024? Aren't these LTNs supposed to be a response to the #ClimateEmergency?

• • •

Missing some Tweet in this thread? You can try to force a refresh
 

Keep Current with Colin Davis

Colin Davis Profile picture

Stay in touch and get notified when new unrolls are available from this author!

Read all threads

This Thread may be Removed Anytime!

PDF

Twitter may remove this content at anytime! Save it as PDF for later use!

Try unrolling a thread yourself!

how to unroll video
  1. Follow @ThreadReaderApp to mention us!

  2. From a Twitter thread mention us with a keyword "unroll"
@threadreaderapp unroll

Practice here first or read more on our help page!

More from @ProfColinDavis

8 Jan
This YouGov poll on the #Colston4 trial verdict illustrates both the virtues of #deliberative processes like juries and also one of their big problems. 🧵

If you take a random (and presumably representative) sample of the population and ...
... give them the evidence, and the time to debate, deliberate and consider that evidence, you’ll (in general) get a much better informed, higher quality decision than the kneejerk (and media-driven) reactions that you get from polls like this one by YouGov. And ...
..that’s good for justice. There’s lots of optimism in some progressive circles about the promise of related deliberative processes for tackling controversial, potentially divisive issues like the sorts of changes we should make to our lifestyles to respond to the climate crisis.
Read 10 tweets
29 Dec 21
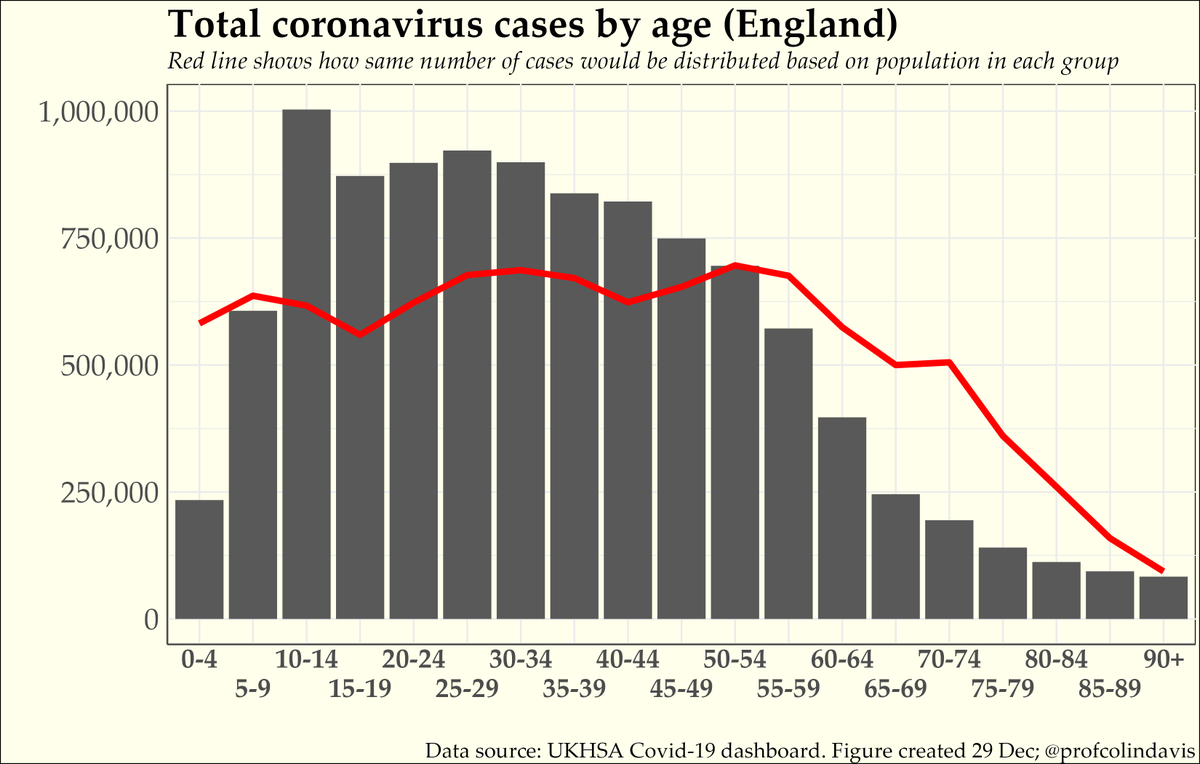
England Covid case data are grouped into about twenty 5-year age bands. For anyone who’s been paying attention it’ll come as no surprise that the first age group to have recorded more than 1 million cases (on Xmas Eve) is 10-14 year olds. Merry Christmas, kids. 🧵
The red line on the graph shows how you’d expect the (roughly) 10 million cases so far in England to be distributed based on population statistics (the size of each age group). As you can see, some groups are over-represented in the cases and others are under-represented.
It’s not surprising that adults of working age are over-represented in the cases, whereas older adults (for whom it is easier to limit contacts) are under-represented. But the over-representation is greatest of all for school-age children.
Read 9 tweets
21 Dec 21
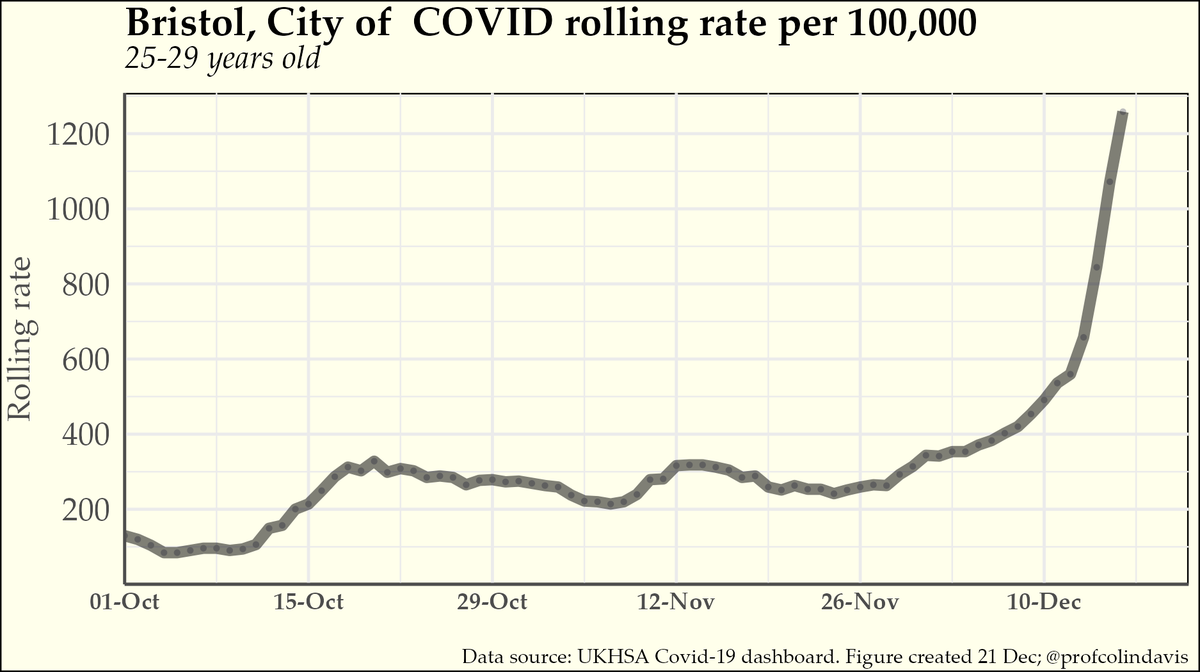
If we look at the age breakdown we see a similar pattern to other places -- the big increase over the last week (red line vs. blue line) has been among young(ish) adults. I think this is largely due to greater socialising in these age groups.
Here, for example, is the plot for 25-29 year olds since October. The rate has approximately doubled in the last three days.
There's been no rise in the 55+ groups yet. That difference between younger and older adults could - in part - reflect a booster effect. But if so, why don't we see a similar increase in cases among unboosted (often unvaccinated) children? (That's why I think it's socialising).
Read 5 tweets
21 Dec 21
I think the "Tory ministers vs scientists" framing is a distraction from the real clash, which isn't about science. More generally, people's beliefs about Covid are not just about evidence -- they also reflect people's motivations.

Here's my take 🧵
Only a tiny minority would (if they’re honest) claim that omicron poses no threat. The majority see that it poses a serious threat, though just how big a threat remains to be established. My focus here is on those who say, "Yes, it's cause for concern, but it'll probably be OK".
Ministers have the power to do something about this threat – but don’t want to. Rejecting the science is a more acceptable way of doing nothing than openly admitting you don’t care abt life-threatening disruptions to public services & the prospects of tens of thousands of deaths.
Read 9 tweets
13 Dec 21
I'm continuing to see people talking about the rate at which sequenced Omicron cases are doubling as if it's a matter of interpretation, or something that different people could reasonably disagree on. It isn’t. It’s like 2+2.
Perhaps it would be useful for me to give a short tutorial on how to calculate doubling rates? It's actually very easy, when you know how. Is anyone interested in that?
OK, looks like there is some interest. So here's a short tutorial for people who never knew how to do this, or who are a bit rusty. I suspect there are a lot of people in this category, so I hope it’ll be useful to them. (I'll deal with qualifiers at the end of this thread).
Read 43 tweets
11 Dec 21
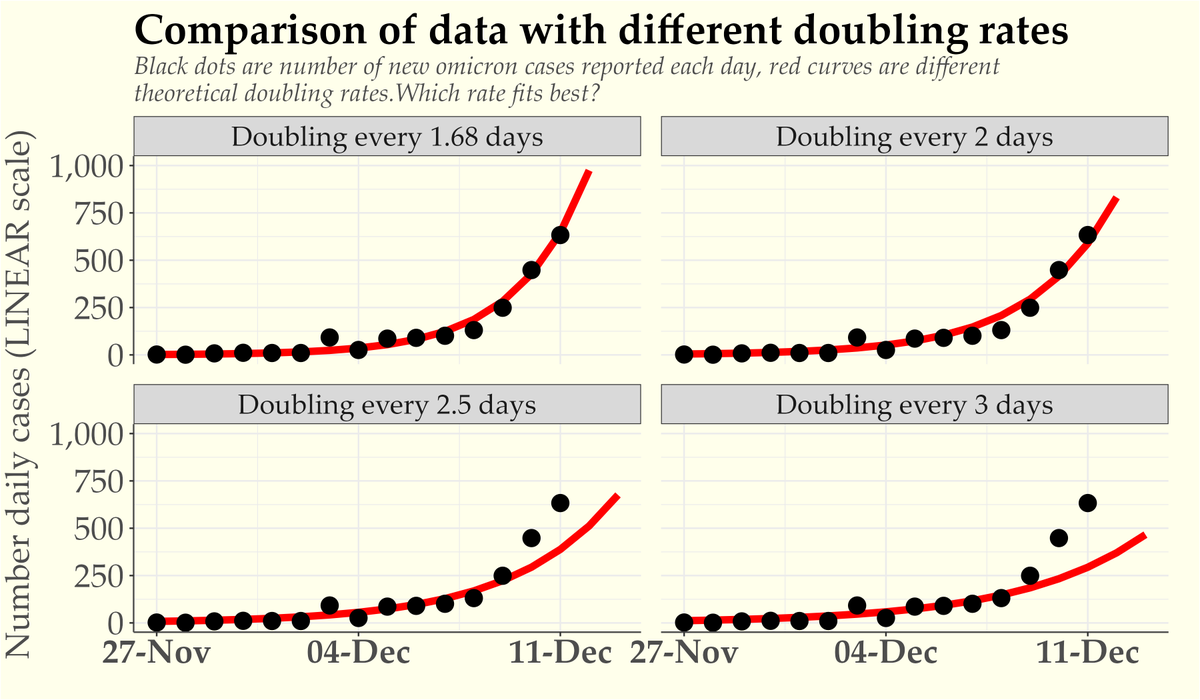
I shouldn't take it personally, but I am starting to feel rather gaslit by people (including experts) talking about omicron cases doubling every 3 days (or 2.5 days). I've plotted the data against different doubling rates below -- how fast do *you* think cases are doubling? Image
The graph above said "log scale" (I forgot to change the label), but it is obviously a linear scale (thanks @UncleJo46902375 ). Here's the correctly labelled version. Image
If you'd like to check my working (please do!), here are the data (two parts):

date newCases total
2021-11-2722
2021-11-2813
2021-11-29811
2021-11-301122
2021-12-011032
2021-12-021042
2021-12-0392134
2021-12-0426160
2021-12-0586246
2021-12-0690336

(cont'd)
Read 4 tweets

Did Thread Reader help you today?

Support us! We are indie developers!


This site is made by just two indie developers on a laptop doing marketing, support and development! Read more about the story.

Become a Premium Member ($3/month or $30/year) and get exclusive features!

Become Premium

Too expensive? Make a small donation by buying us coffee ($5) or help with server cost ($10)

Donate via Paypal

Or Donate anonymously using crypto!

Ethereum

0xfe58350B80634f60Fa6Dc149a72b4DFbc17D341E copy

Bitcoin

3ATGMxNzCUFzxpMCHL5sWSt4DVtS8UqXpi copy

Thank you for your support!

Follow Us on Twitter!

:(