1/5
A thread to go over my interpretation of interest rates.

First this is what the market currently has priced in. 36% for the 5th hike in Feb 2023 is the highest ever.

First hike in March is now 86%. At this point any talk of no hike in March would move the market.
2/5

Earlier this morning Mike Wilson of Morgan Stanley was on Bloomberg TV. He is looking for 1.60% on 2-year yields at mid-year (from 0.945%).
3/5

This fits our view that the 10-year minus 2-year curve can invert by mid-year.
4/5

Why are 10yr ylds trending sideways as 2yr ylds relentlessly rise?

10yr ylds are a risk-off instrument, not an inflation pay. The fact that 10yr ylds are not rising in the face of inflation is a market signal that the Fed is going to hike too much and break something.
5/5

We will know when the Fed has “broken something” when/if the yield curve inverts.

It might not be obvious what broke the day the yield curve inverts, but the market will be signaling that something is indeed broken and it will be apparent in short order.
Bonus

Why will the Fed hike so much they will break something?

Inflation got away from them and is now intensely political. The economists can leave the FOMC board room. Hiking to address inflation is now the domain of politics and PR people worried about Fed optics.

• • •

Missing some Tweet in this thread? You can try to force a refresh
 

Keep Current with Jim Bianco biancoresearch.eth

Jim Bianco biancoresearch.eth Profile picture

Stay in touch and get notified when new unrolls are available from this author!

Read all threads

This Thread may be Removed Anytime!

PDF

Twitter may remove this content at anytime! Save it as PDF for later use!

Try unrolling a thread yourself!

how to unroll video
  1. Follow @ThreadReaderApp to mention us!

  2. From a Twitter thread mention us with a keyword "unroll"
@threadreaderapp unroll

Practice here first or read more on our help page!

More from @biancoresearch

9 Jan
1/14

In some respects, what happened in bond markets last week was epic, something we might be talking about for many years.

A thread to explain
2/14

When discussing bond market moves, I believe the best metric is total return. It encompasses both price change and the level of yields (accrued interest).

The next set of charts show calendar week total returns. That is, the week ending Friday (Thursday if a holiday).
3/14

The 30-year data goes back to 1973 and last week was the worst calendar week total return in at least 49-year history! The long-bond lost 9.35%!!

If this was a year, a 9.35% total return loss would be the 5-year worst year ever.

Impressive for five days of work.
Read 14 tweets
6 Jan
1/5

Narrative is US cases will peak any day following South Africa pattern.

Keep in mind:

* South Africa is only 30% vaxxed (US 63%)
* It's young with few restrictions
* So, everyone "breathed on each other" cases went up 100x in 30 days and then peaked.
2/5

Why isn't Europe a better model for the US?

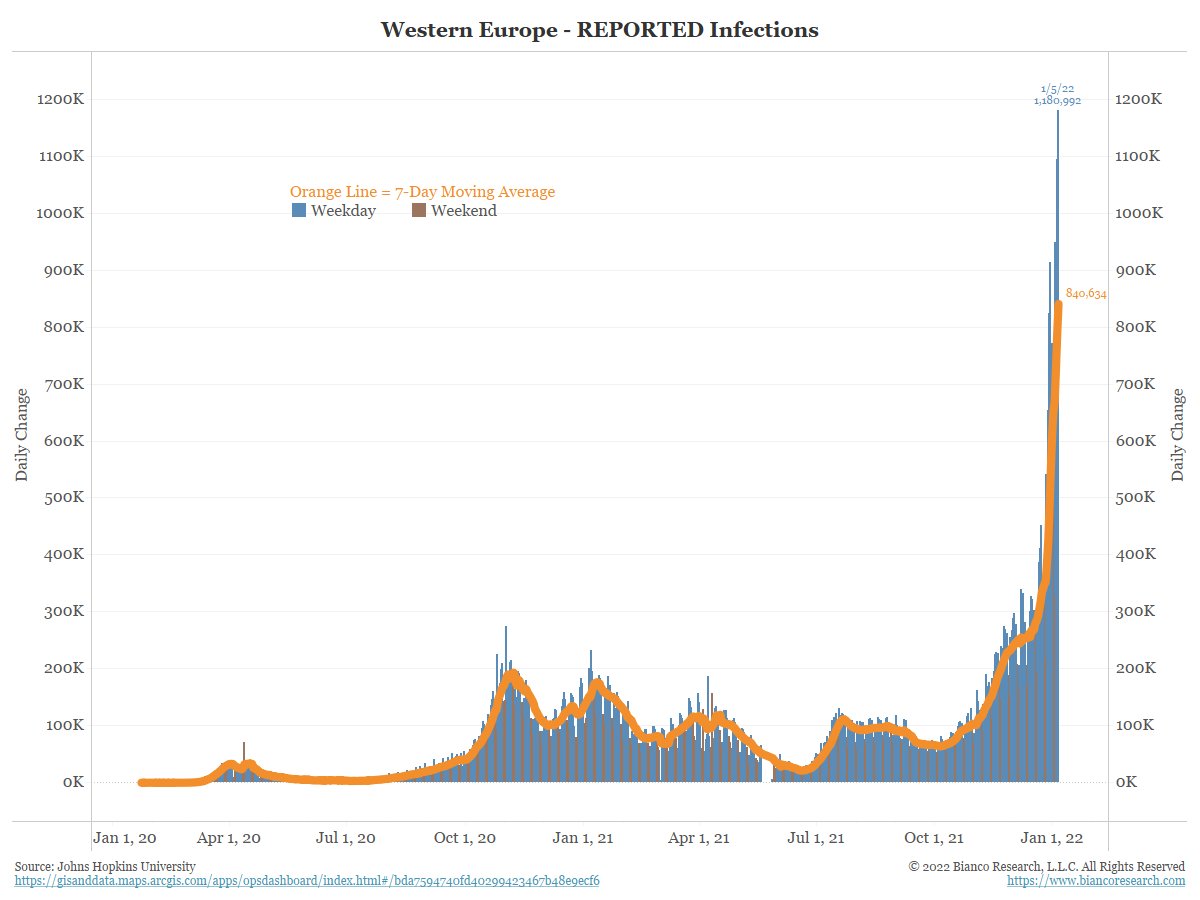
They are trying to prevent spread with restrictions/lockdowns (Dutch). So, they are dragging it out and made another new high yesterday.

EU is not willing to go 100x in 30 days like SA, so they are taking a longer time to peak.
3/5
If the US was indeed following South Africa and going to peak any day, our 7-day positive avg would be about 3M now, not ~600k.

We are trying to slow it down, and it is working!! EU leads the US by 6 weeks. If the EU peaks today, the US peaks in 2H of Feb at the earliest.
Read 5 tweets
5 Jan
1/8

Nothing the Fed said today should have been a surprise.

The problem was the market just did not want to believe it until the minutes came out.

Now it hit them like a brick to the face.

A thread to explain

2/8

The orange line is the probability of a March hike. It has been above 50% since December 21, over 2 weeks now.

The blue line is a June rate hike. That has been priced in since late-Oct.

The Fed minutes should not have been a surprised, it's been priced in for some time.
3/8

For a while I've talked about the disconnect between what the market has priced in and what the consensus says will happen. It is rare the market pricing is NOT the consensus view.
Read 8 tweets
5 Jan
1/3

Just shy of 5 million Americans have tested positive in the last 10 days. This is 2.50% of the workforce.
2/3

Anecdotally ... companies are so confused by the CDC, and so scared by the liability of sick employees returning too fast, that they are ignoring the constantly shifting CDC/Fauci advice and requiring a 10-day quarantine followed by a negative test to return to work.
3/3

That is assuming one can even get a test in the first place.

So, yes, this is becoming a huge drag on production with this much of the workforce on "injured reserve."

Demand holding in, production lagging from a thinning workforce = more inflation.
Read 4 tweets
3 Jan
1/5

In 2021, the SPX beat the DJIA, NDX. Nasdaq Comp, Russell 1000, 2000, 3000.

For the SPX to be #1 in this group is rare, even more rare when it is not a down year.

Why?

A thread with some ideas

@LynAldenContact @ritholtz
2/5

Let start with a truism ... the "stock market" is really one thing, SPY.

Stock picking is something that we talk about on twitter and only those that underperform actually do.

The more one picks stocks, the worse they underperform. detailed here

spglobal.com/spdji/en/docum…
3/5

And there is only one vehicle to invest in the, the index ETF, which really means SPY (or its forks).

This is chart of all ETF flows, but it is really SPY and its forks.

All this money rams the index higher. Not in the index? You are way behind.

@RobinWigg
Read 5 tweets
3 Jan
1/4

Interesting returns reacords in 2021.
A thread to detail.

The Bloomberg Barclays U.S. Treasury Index returned -2.32% in 2021, which ranks as the fifth worst year on record (data goes back to 1973).

@ritholtz
2/4

Energy stocks experienced their best year on record. The S&P Energy Index returned 54.64%, more than doubling the returns of all but the financials and info tech sectors.
3/4

Whether calculating returns in U.S. dollars or local currency, U.S. equities topped almost all other developed countries in 2021. In dollar currency terms, the MSCI U.S. Index outpaced the MSCI World Ex-U.S. Index by almost 14% last year.
Read 4 tweets

Did Thread Reader help you today?

Support us! We are indie developers!


This site is made by just two indie developers on a laptop doing marketing, support and development! Read more about the story.

Become a Premium Member ($3/month or $30/year) and get exclusive features!

Become Premium

Too expensive? Make a small donation by buying us coffee ($5) or help with server cost ($10)

Donate via Paypal

Or Donate anonymously using crypto!

Ethereum

0xfe58350B80634f60Fa6Dc149a72b4DFbc17D341E copy

Bitcoin

3ATGMxNzCUFzxpMCHL5sWSt4DVtS8UqXpi copy

Thank you for your support!

Follow Us on Twitter!

:(