Aksel Kibar, CMT Profile picture
Feb 5, 2022 5 tweets 2 min read Read on X
Taking one signal (clue) at a time. I usually like to go step by step. Don't read too much into charts. We can't see 4-5 steps ahead.

Here is how I analyzed $IWC Image
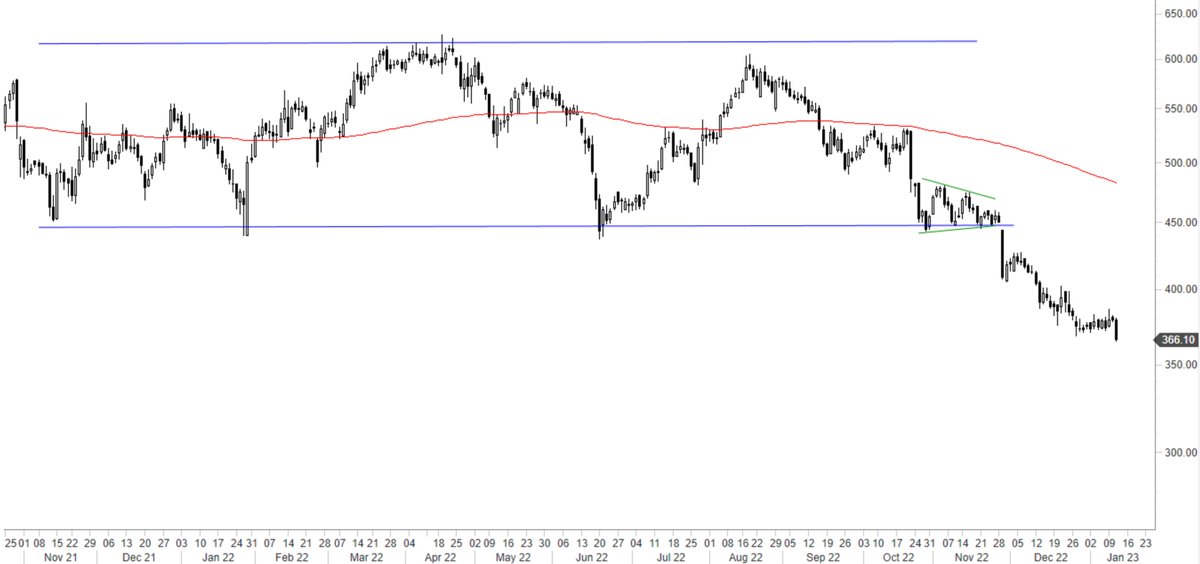
In following week's update what I was looking on price chart. $IWC Image
$IWC failed to recover above the long-term average and risked a breakdown of the lower boundary. Image
The signal was triggered during the week with a breakdown below minor lows. Image
Where we currently stand on $IWC Image

• • •

Missing some Tweet in this thread? You can try to force a refresh
 

Keep Current with Aksel Kibar, CMT

Aksel Kibar, CMT Profile picture

Stay in touch and get notified when new unrolls are available from this author!

Read all threads

This Thread may be Removed Anytime!

PDF

Twitter may remove this content at anytime! Save it as PDF for later use!

Try unrolling a thread yourself!

how to unroll video
  1. Follow @ThreadReaderApp to mention us!

  2. From a Twitter thread mention us with a keyword "unroll"
@threadreaderapp unroll

Practice here first or read more on our help page!

More from @TechCharts

Jan 11, 2023
#THREAD A text-book example that we can learn many fine points of classical charting and technical analysis. $LAUL.NS #INDIA #SENSEX #NIFTY
1) A well-defined horizontal boundary being tested several times before a breakout or breakdown.
2) Right before the breakdown, a short-term chart pattern (pennant) is forming in preparation for a breakdown. Difficulty to rebound from strong support, early indication of a pending breakdown.
Read 4 tweets
Oct 13, 2022
A #thread on impatience and regret cycle.

This is not about charts. It is about the frequently read and discussed trading journal and record keeping.

How it can help to overcome your impatience with an ongoing trade and the constant urge to do something about it.
I'm a big believer of setting strategy/tactics and managing trades when markets are closed. I try to avoid making decisions when markets are open. I can't say I have fully mastered it but with today's technology it is becoming easier to resist the temptation to override decisions
How many times you have acted on a breakout, placed stop-losses, had price targets in place but exited much earlier that the plan? Took profits but left a big chunk on the table...
Read 8 tweets
Dec 5, 2021
Another nugget for you.

If you have identified a set of 100 or let's say 500 instruments to review...

Unless you make it a habit to review them each day around the same time, you will miss opportunities and lack the visual training as patterns develop.
1 year of data loaded on daily scale chart. We look at the right side of the chart to find horizontal setup with several tests of pattern boundary.

Do you now see what we are looking for?
I doubt anyone who is going through their chart studies on a daily basis with the same template diligently will miss this setup.
Read 4 tweets
Dec 3, 2021
I don't trade those short-term H&S top patterns. For those who trade $MSFT can come under pressure for couple of days. Image
$MSFT short-term H&S top neckline at 328.5. Lower boundary of an arguable trend channel at 310. Image
#NATRUALGAS Probably same idea but slightly different duration and different instrument as well. Image
Read 4 tweets
Oct 22, 2021
Was this a pullback? We will find out in the next couple of trading sessions $EUR #FX Image
Update on $EUR #FX Image
Update on $EUR #FX. Volatility is low. That means whichever direction we start accelerating, highly likely we get a decent trend.

I see this as a breakdown and pullback completed. Image
Read 7 tweets
Oct 16, 2021
The way I tackle price charts:

From past price studies I have an idea of how price should behave around certain levels.

Then I say: If A happens then B is more likely. If I see B then it is a sign of C.
#COPPER is a good example. I have been analyzing price action above the 200-day average. The rebounds have been weak.

I said if it remains weak, (A happens) then a breakdown and correction (B) is more likely.

Ideal situation in a reversion to the mean is a sharp rebound.
This is how I analyzed price action and narrowed it down to 4.08-4.35.

Ideally a reversion to the mean was followed by a sharp rebound.
Read 4 tweets

Did Thread Reader help you today?

Support us! We are indie developers!


This site is made by just two indie developers on a laptop doing marketing, support and development! Read more about the story.

Become a Premium Member ($3/month or $30/year) and get exclusive features!

Become Premium

Don't want to be a Premium member but still want to support us?

Make a small donation by buying us coffee ($5) or help with server cost ($10)

Donate via Paypal

Or Donate anonymously using crypto!

Ethereum

0xfe58350B80634f60Fa6Dc149a72b4DFbc17D341E copy

Bitcoin

3ATGMxNzCUFzxpMCHL5sWSt4DVtS8UqXpi copy

Thank you for your support!

Follow Us!

:(