Here is an indispensable piece of work to understand the global dynamics of environmental pressures. Thomas Wiedmann & Manfred Lenzen in @NatureGeosci.
🧵
In a globalised economy, many processes of production scatter through complex, international supply chains. To calculate the footprint of one single country, one must keep track of all the impacts its consumption has abroad.
This article is a review of the empirical literature that has looked at the environmental and social impacts embodied in international trade.
I often hear that high-income countries have clean air because of technology and environmental awareness. In fact, they do mostly because they outsource their most pollutive productions abroad.
This pattern repeats itself for other environmental impacts. For example, 50% of the biodiversity footprint of developed economies happens outside of their borders.
If it looks like the EU has a sustainable use of water, it's because 80% of the water scarcity situations its consumption creates happen in other countries.
Here is a case of 'decoupling through burden shifting': high-income nations pride themselves in using less materials domestically, but this happens at the expense of using more materials in countries who export products to the global North.
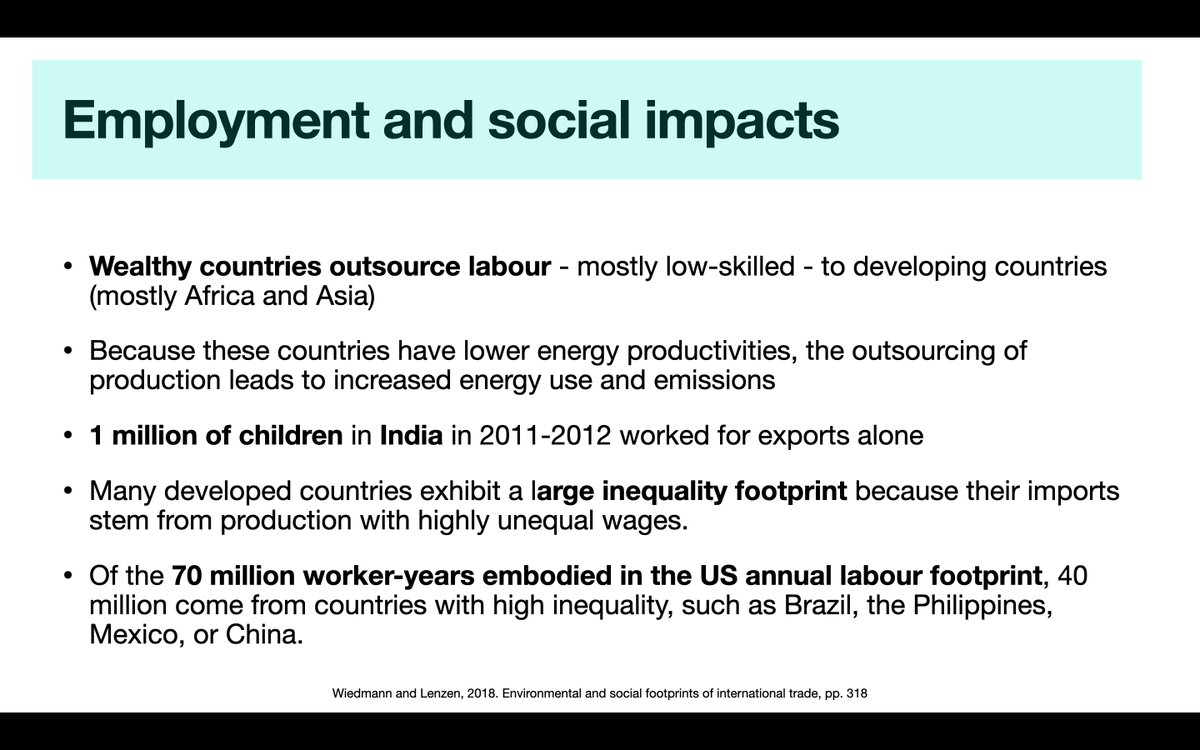
Similar patterns also exist for social impacts. For exemple, many rich nations have a high 'inequality footprint' because they import products from countries with very low wages.
One way of visualising these patterns is to look at the average physical distance of a national footprint, which becomes a measure of how much of the national social-environmental burden is shifted to other countries.
Take-home message: the green growth of rich nations is often a mirage caused by narrow indicators. When looking at the global picture, the illusion of decoupling disappears.
An interesting article by @JPTilsted et al. on the "green" growth of Nordic countries (that is actually not as green as you may have heard).
🧵
The article criticises the concept of "Genuine Green Growth" from @estoknes and @jrockstrom arguing that the growth of Nordic countries is not as genuine and green as it seems.
In the Stoknes & Rockström paper, the authors show that the emission patterns of Nordic countries sometime meets the green growth requirement of a yearly 5% improvement in carbon productivity (the straight blue line).
One of my favourite papers of 2021: "The social shortfall and ecological overshoot of nations" by @AndrewLFanning, @DrDanONeill, @jasonhickel, and Nicolas Roux.
🧵
The paper looks at 11 social and 6 environmental indicators for 140 countries between 1992 and 2015. It also models 'business-as-usual' projections up to 2050.
This donut-shaped figure shows which ecological boundaries are transgressed: the 'OVERSHOOT' (the red bits outward), and which social foundations are unreached: the 'SHORTFALL" (the red bits inward).
Close to half of all emissions since the industrial revolution have been produced since 1990, the year of the first report by the Intergovernmental Panel on Climate Change (IPCC).
At current global emissions rates, the 1.5°C budget will be depleted in 6 years and the 2°C budget in 18 years. The per capita sustainable budget compatible with the 1.5°C limit is 1.1 tonne of CO2 per annum per person, i.e. about 6 times less than the current global average.
A study by @jasonhickel, Dylan Sullivan, and @huzaifazoom that quantifies drain from the global South through unequal exchange since 1960.
THREAD
In 2017, the most recent year of data, drain through unequal exchange amounted to $2.2 trillion; in other words, it was equivalent to the quantity of Northern commodities that one could buy in that year with $2.2 trillion.
Appropriation via unequal exchange increases (1) when the volume of international trade grows (extensive growth), and (2) when the price gap between North and South widens (extensive growth).
This recent study by @C_Dorninger et al. shows that economic growth in high-income nations occurs at the expense of poorer countries.
THREAD
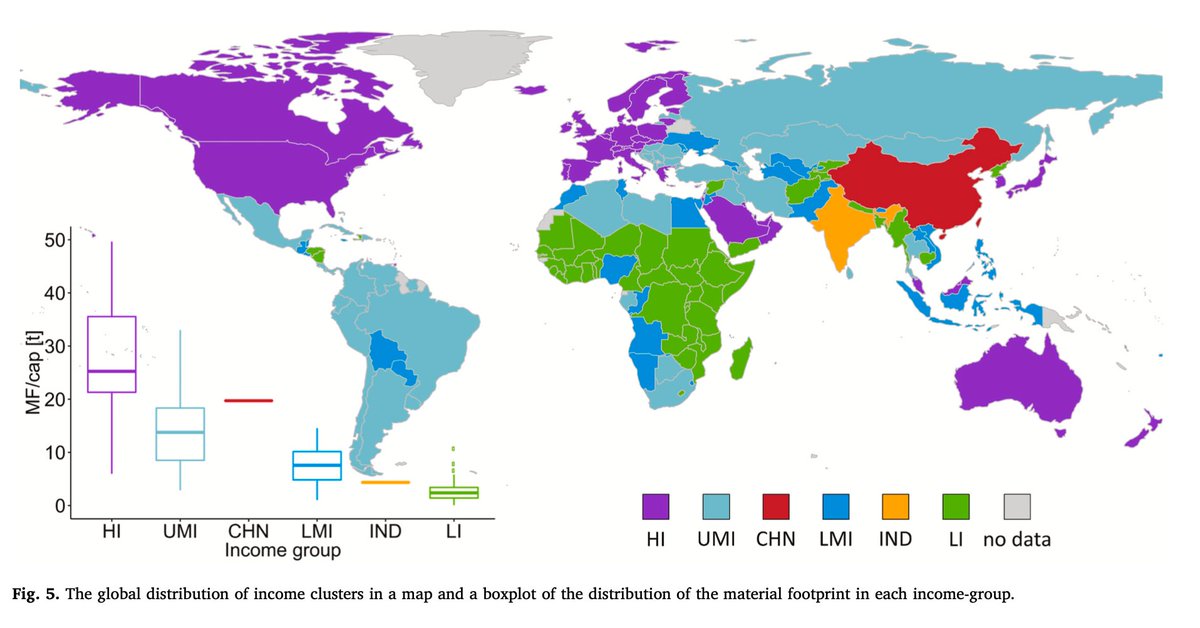
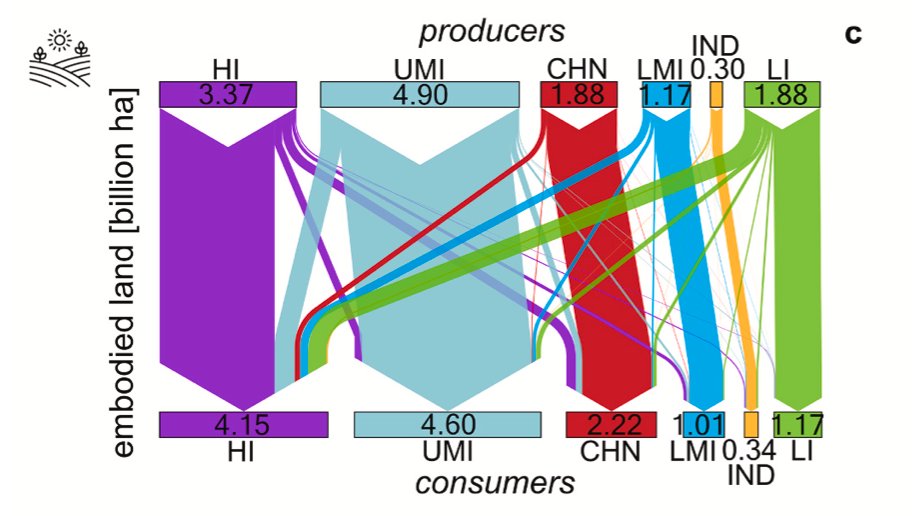
Across the embodied flows of materials, energy, land, and labor, rich countries (in purple) used more resources from a consumption perspective than they provided through production.
For example, high-income countries are the largest net appropriators of land (of approximately 0.8 billion hectares per year). Their land footprint correspond to 31% of total global land used.