1/ #Bitcoin price thread: 2022 and beyond
In this thread I am dissecting the #Bitcoin price with a ton of insights. I will also share my vision where the Bitcoin is heading and how the Bitcoin price will behave in the future!
In this thread I am dissecting the #Bitcoin price with a ton of insights. I will also share my vision where the Bitcoin is heading and how the Bitcoin price will behave in the future!

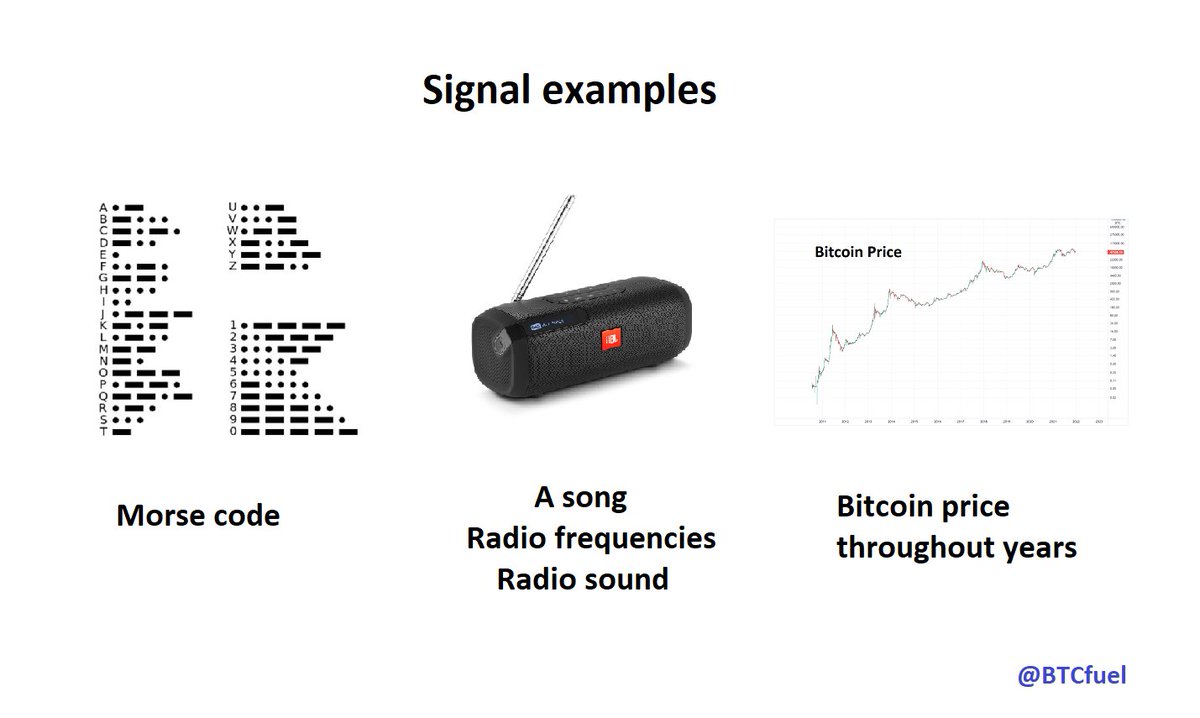
2/ The basic thought throughout this thread is this. When you are looking at the #Bitcoin price you are looking at a superposition of investment behaviors. This way I identified 3 major layers. The Bitcoin price is the combination of 3 layers or behaviors
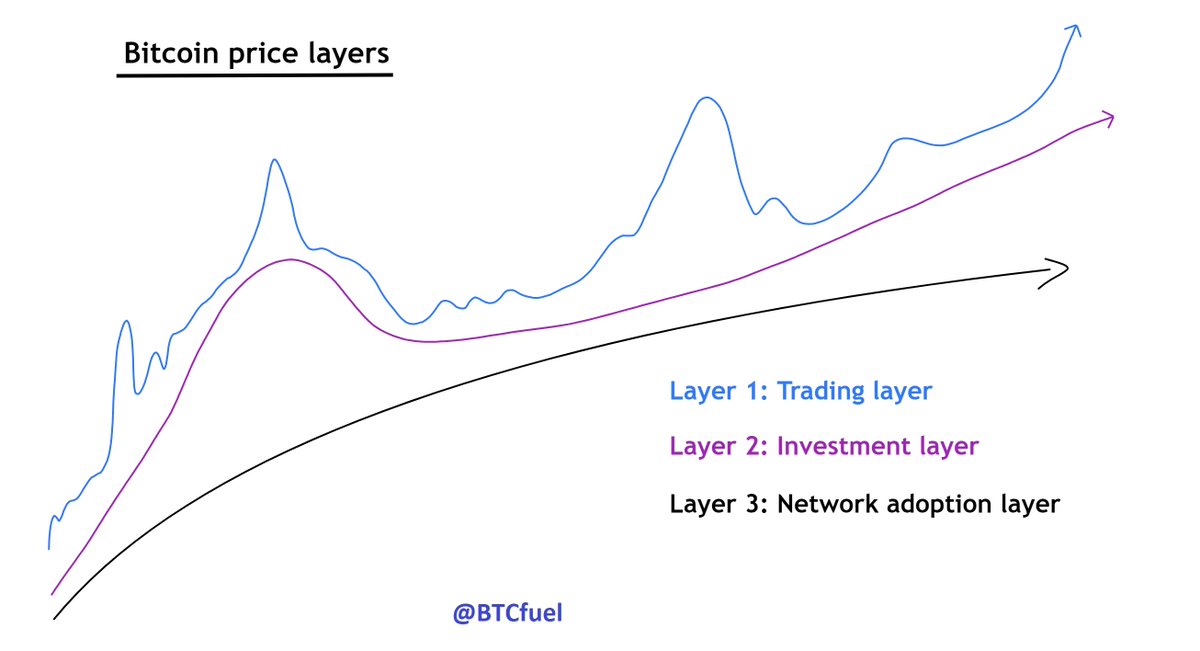
3/ Layer 3 is the base layer. Over time the world will adopt the #Bitcoin network. Layer 3 is about this adoption. This adoption is similar to the network adoption of e.g. the internet or Facebook. Layer 3 is the main support of the bitcoin price (bottom chart @raoulgmi)

4/ Layer 2 is the investing layer. For investing there needs to be an investment case. The case for #Bitcoin amongst others is to become a better version of gold. The image shows reasons why people invest in gold & Bitcoin. Therefore lets zoom into both gold & Bitcoin

5/ This is how gold behaved in the past. Inflation and bear markets (or fear of) seem to have a clear relation with the price of gold

6/ #Bitcoin looked dead between 2014 and 2016. The stock market recovered from 2008 crash and the inflation was below 1%. Governments want inflation between 1% and 3%. Above Bitcoin 1% moves more energetic. In the recent years there was also lots of money printing

7/ So similar to gold inflation and bear markets (+fears) are investment cases for #bitcoin, thus a reason why people invest in Bitcoin and the price goes up. Money leaves when both inflation and bear markets are gone.
8/ Both Bitcoin and gold are technologies, that’s why it’s interesting to look the “market curve” for new technologies. Yes gold too, in the 70’s it was a reinvented/ repurposed technology for the new phenomenon of stagflation
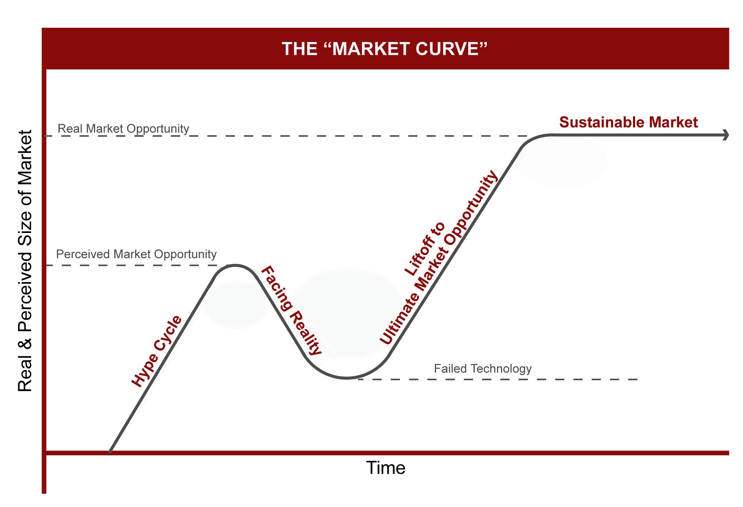
9/ This is how I applied the market curve for #Bitcoin and gold. The different stages seem to overlap with inflation/ bear market fears time zones. It also shows that Bitcoin is in the lift-off stage which happened for gold in 1999 – 2011

10/ I compared both zones and I found out that in the back, #Bitcoin has been behaving as 1999 - 2011 gold FOR 8 YEARS since 2013. The RSI is key: it’s a relative measure and you get pure a behavior signal as a result which is almost exactly the same for gold in the same stage

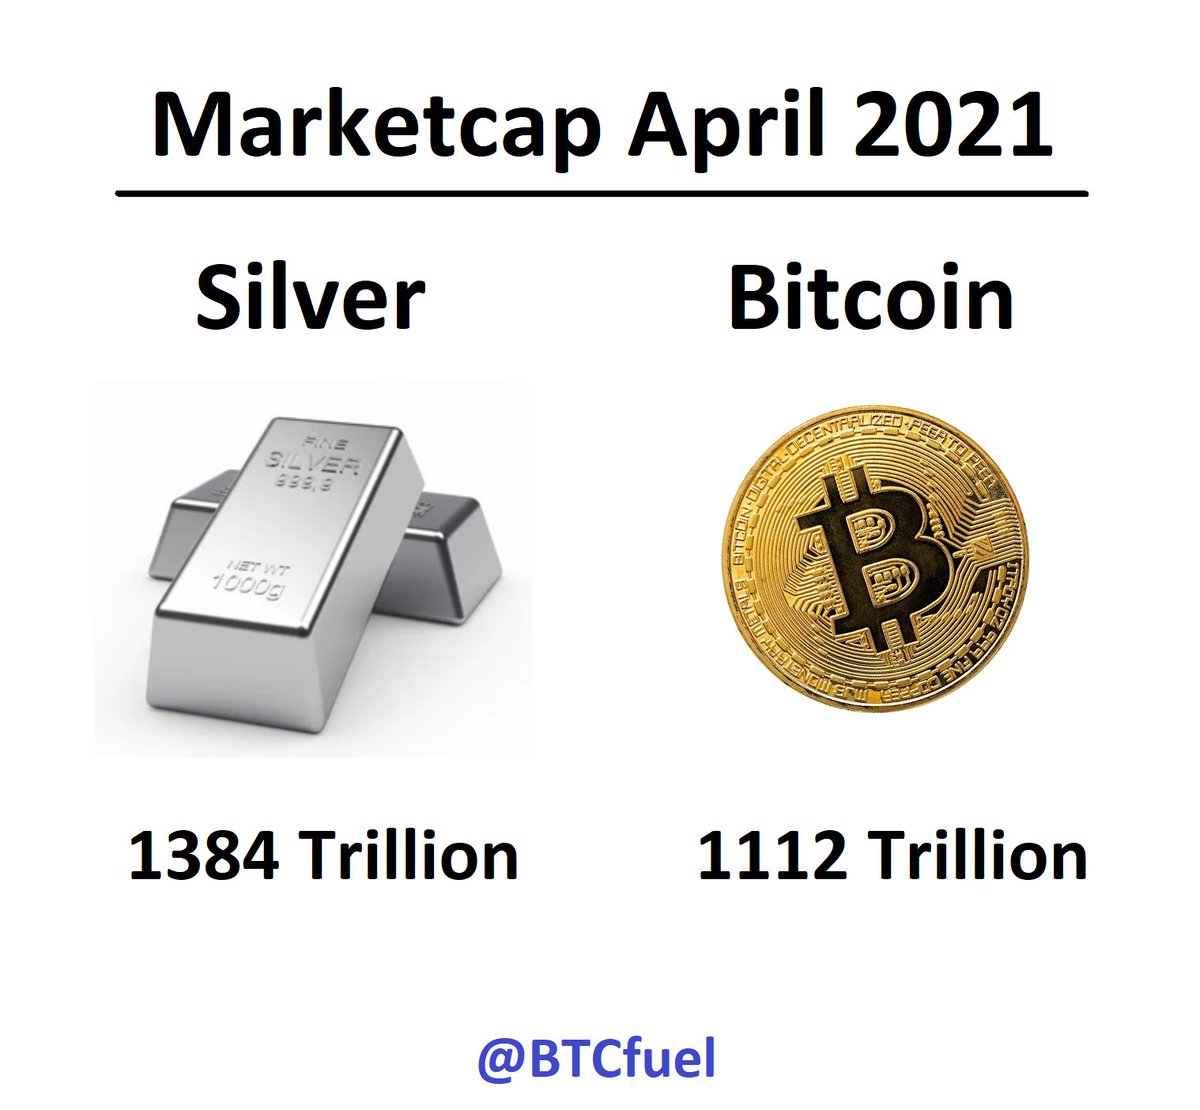
11/ All of this makes very much sense Bitcoin is digital gold and people are already investing and using it like that. With a marketcap of 1 trillion #Bitcoin is already an established asset. Real investing layer 2 is an important pattern underneath the trading layer 1
12/ The 2017 cycle top was for #Bitcoin as digital gold a deviation (energy wise). This peak was a result of the combination: the crypto markets genesis, Bitcoin as part of a crypto portfolio, new ATH, lengthening cycles effect. It was not so much about Bitcoin itself

13/ Now this. Gold has a 8 year low to low and a 11 year low to high cycle. The last low was dec 2015. The next low should be end of 2023 or early 2024. The next high should be in the end of 2026 or early 2027

14/ In order for #Bitcoin to take over gold, it needs to tune in with the investment behaviors that determine the gold price and therefore tune in with the cycles of gold. The 1999 – 2011 gold pattern fits this perfectly!

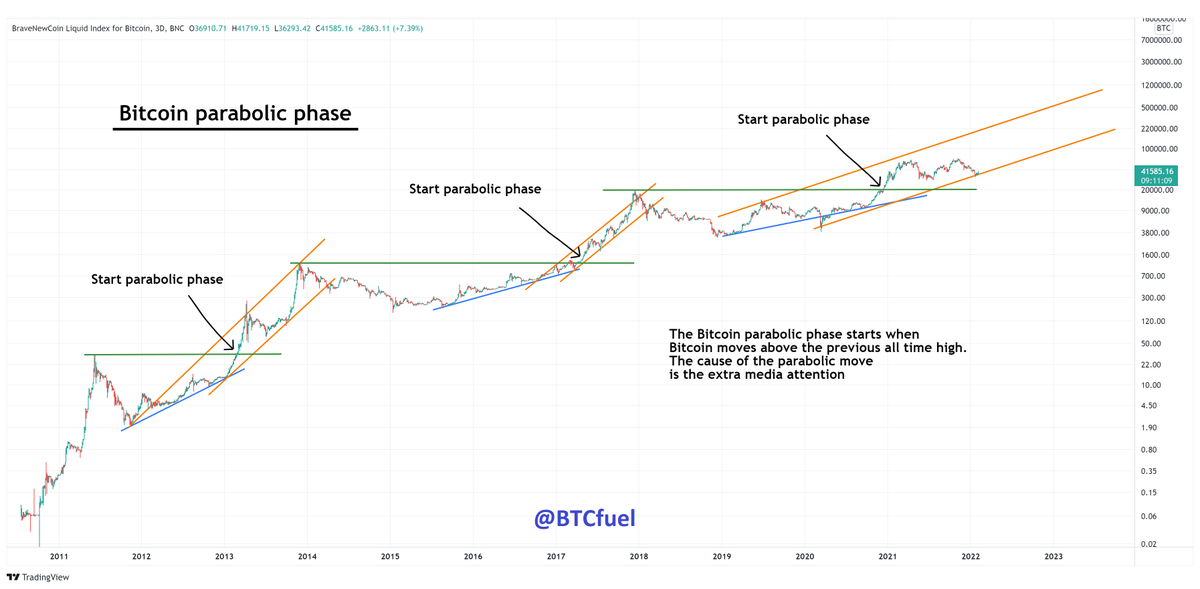
15/ Layer 1 is the trading layer. It’s where all the short term action happens. Short is a relative concept. In the classical view, investing is about 5 to 10+ years. This means that buying low and then selling the cycle top is trading for #Bitcoin. A lot of people confuse this

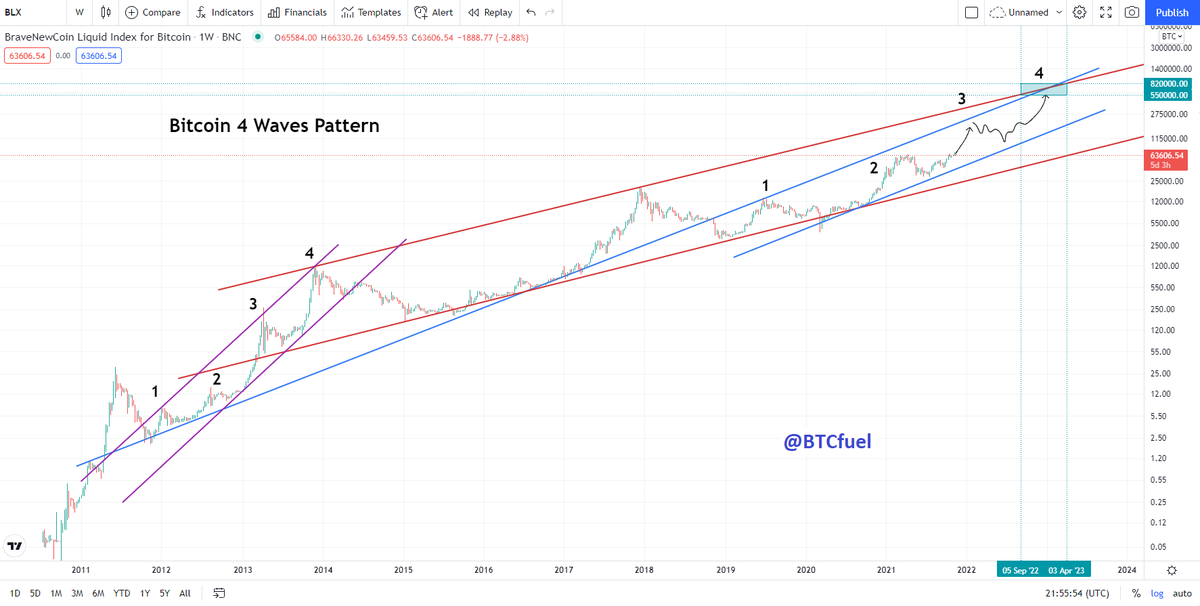
16/ The parabolicness of #Bitcoin starts near a new ATH when the media starts reporting about it. The news spreads like a wildfire and people start buying because of green candles. The “gold rush” is a trading behavior, people want the quick buck
17/ In the Realized Cap HODL waves chart we see that every parabola has 4 demand waves. However this cycle demand is already really high early on in the cycle. This could indicate that the cycle effect is disappearing or gone

18/ Bitcoin’s gold pattern will be more dominant. Because in reality people are advising each other #Bitcoin for the long term and buying it that way. Especially big money which really moves the price, is investing for the long term. Cycle traders are trading altcoins
19/ I do believe there is still a small cycle effect for #Bitcoin however its gold pattern is becoming more dominant. The cycle behavior could however indicate a local top. I’m mainly looking at February – March 2023 for that. It’s also a top in the gold pattern

20/ There maybe could be a sequence behind the lengthening cycles. It seems that the cycle length extension is diminishing. These are my calculations for a possible next cycle length. This could maybe be related to the normal distribution, exponential decay, damped oscillations..

21/ #Litecoin is digital silver and, it’s an oscillator to #Bitcoin. It is correlated to Bitcoin in the broadest meaning of the word. As a consequence it contains a little bit of information about Bitcoin. For now, the Litecoin pattern indicates a local top near March 2023

22/ Back in 2016 the #Bitcoin balance on exchanges was already diminishing. The long term investment use of Bitcoin as digital gold started there. But Bitcoin moved up faster than expected so people sent their money back to exchanges to sell

23/ About the first years of #Bitcoin, this is useful to know. At the end of a long bull run, the blue chip assets go flat and money flows to the newest, riskier technology hype. They decouple from the rest of the market and blow off. Examples DJI vs Nasdaq and Gold vs Bitcoin

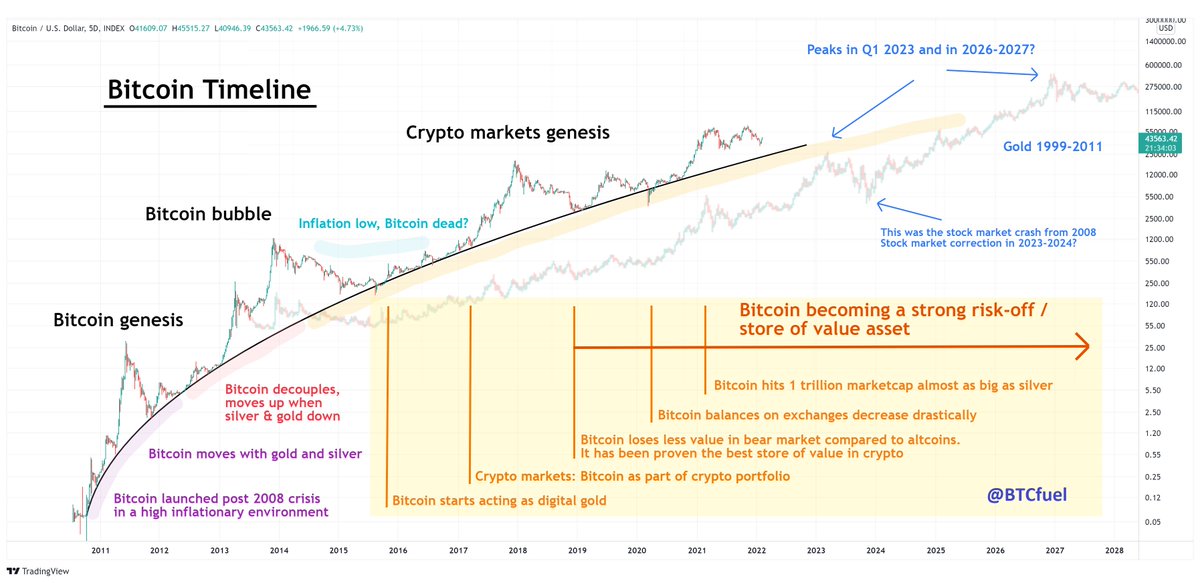
24/ Back in 2010-2013 #Bitcoin was an alternative to gold like silver and was closely following silver in 2011 until it decoupled from the rest of the commodity market in 2013. Profits from silver and gold flowed massively into Bitcoin

25/ This is a timeline of #Bitcoin that contains some past behaviors and events in order to better understand future behavior
26/ This is how I see #Bitcoin evolving in the long term, and the dominant influence for the price:
Stage 1: tech hype/ layer 1: trading dominant
Stage 2: digital gold/ layer 2: investing dominant
Stage 3: global monetary network / layer 3: network use - adoption dominant
Stage 1: tech hype/ layer 1: trading dominant
Stage 2: digital gold/ layer 2: investing dominant
Stage 3: global monetary network / layer 3: network use - adoption dominant

27/ At last, to me this pattern is the best #Bitcoin model out there right now. To me, this pattern is the backbone of the Bitcoin price right now. It’s not just some pattern. It’s an evolving market development pattern and a stage of the Bitcoin revolution

• • •
Missing some Tweet in this thread? You can try to
force a refresh