1/4
This morning the UM released monthly survey of consumers. To put it bluntly, this was not a good report.
Current level of consumer confidence is below the levels seen in April 2020 when the world was locked down. Its current reading is near levels associated with the GFC.
This morning the UM released monthly survey of consumers. To put it bluntly, this was not a good report.
Current level of consumer confidence is below the levels seen in April 2020 when the world was locked down. Its current reading is near levels associated with the GFC.

2/4
Half the country thinks their standard of living is going to fall because of inflation, as explained here.
sca.isr.umich.edu
Half the country thinks their standard of living is going to fall because of inflation, as explained here.
sca.isr.umich.edu
3/4
This puts the Fed in an impossible position.
* Help the half that sees inflation hurting them by aggressively hiking rates.
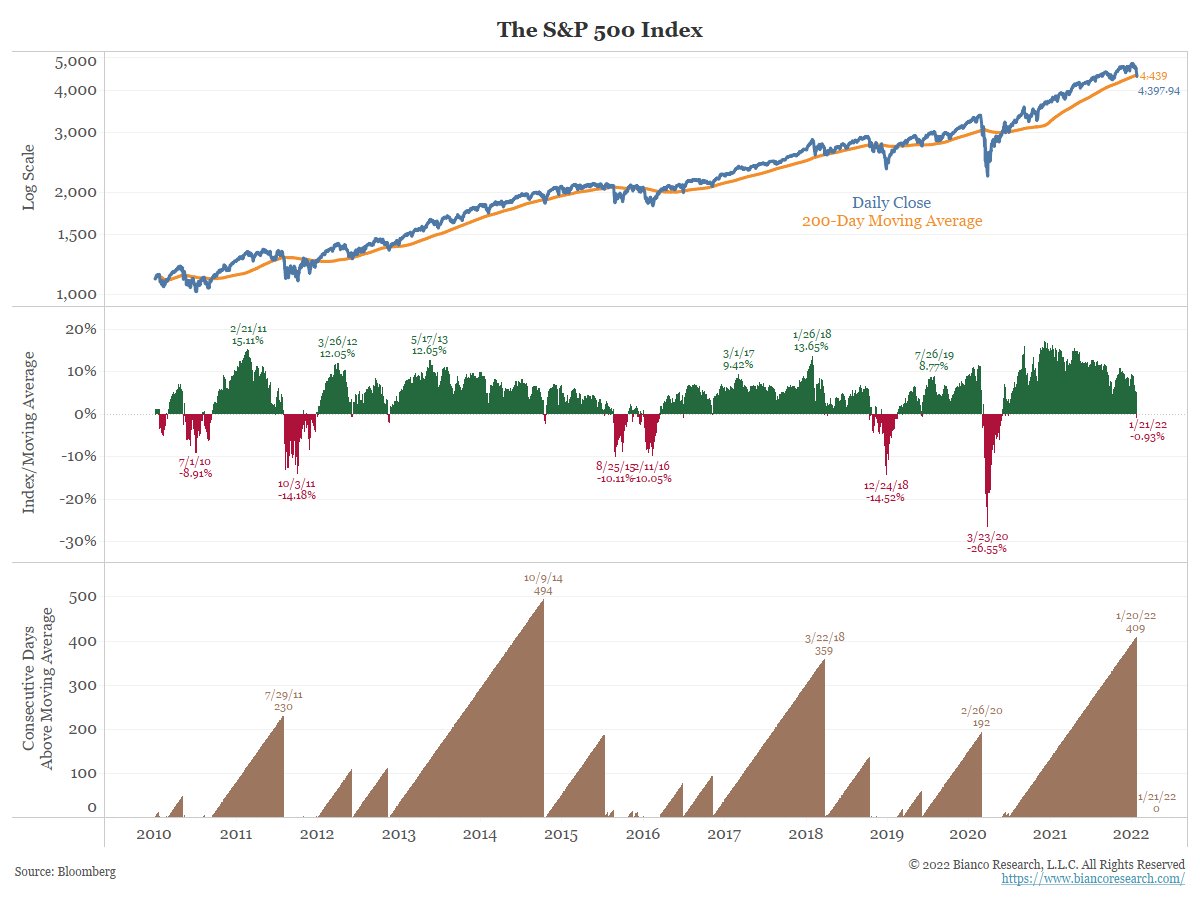
* Help those with incomes > $100K by not hiking aggressively in order to prop up stock prices.
This puts the Fed in an impossible position.
* Help the half that sees inflation hurting them by aggressively hiking rates.
* Help those with incomes > $100K by not hiking aggressively in order to prop up stock prices.
4/4
The Fed has to pick one or the other but cannot help both groups with one policy.
We continue to think they choose to help those who are falling behind inflation by aggressively hiking.
The Fed has to pick one or the other but cannot help both groups with one policy.
We continue to think they choose to help those who are falling behind inflation by aggressively hiking.
• • •
Missing some Tweet in this thread? You can try to
force a refresh


