1/3

Powell might not be chairman in 2 weeks, and it will not matter.

Sherrod Brown (D, OH), the head of the Senate finance committee, said the committee will most likely vote on the Powell/Brainard nominations in early Feb.
No date on the full Senate floor confirmation vote.
2/3

Powell's term as Fed Chairman ends January 31. His term as a "regular" Fed governor expires in 2028.

(The Fed chairman is also a "regular" Fed Governor, think of them as two separate things)
3/3

Brown told the press yesterday it doesn't matter that Powell technically expires as Chairman on the 31st.

All parties will probably agree to treat him as the Fed Chairman, and everything continues as is.

Your dysfunctional Government making things up.

@DiMartinoBooth
Regarding my last comment about "making things up" ... Thanks to @mckonomy for setting me straight...

The law says Fed officials can continue on the job until their successor is sworn in. So, Powell would remain Chairman of the Federal Reserve Board until a successor is in place
But since Powell is the successor, it doesn't make much of a difference.

As for the FOMC, the committee elects its chairman for the year each in January.

By tradition it's always the chairman of the Board of Governors, but it doesn't have to be.
The FOMC chair doesn't even have to work at the Fed.

In theory, Jim Bianco could be named chairman of the FOMC.

So even if he's not officially confirmed as chairman of the board, Powell will be reelected as chair of the FOMC on Jan 26.
Given this ...

I look forward to my appointment next week!

In my acceptance speech I will quote Groucho Marx ...

"I refuse to join any club that would have me as a member."

• • •

Missing some Tweet in this thread? You can try to force a refresh
 

Keep Current with Jim Bianco biancoresearch.eth

Jim Bianco biancoresearch.eth Profile picture

Stay in touch and get notified when new unrolls are available from this author!

Read all threads

This Thread may be Removed Anytime!

PDF

Twitter may remove this content at anytime! Save it as PDF for later use!

Try unrolling a thread yourself!

how to unroll video
  1. Follow @ThreadReaderApp to mention us!

  2. From a Twitter thread mention us with a keyword "unroll"
@threadreaderapp unroll

Practice here first or read more on our help page!

More from @biancoresearch

Jan 21
1/7

I typically do not get into the weeds with short term outlooks. But in this 🧵I will make an exception.

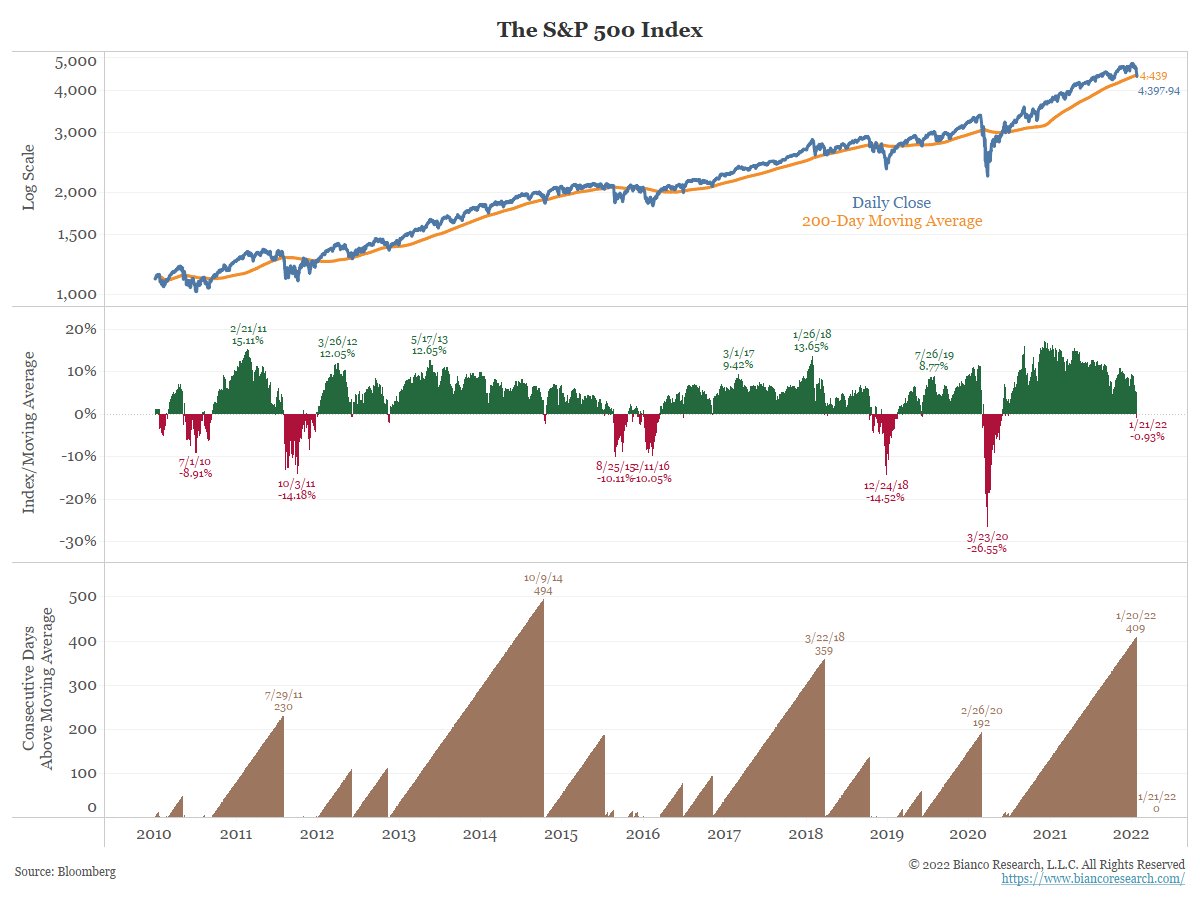
I see the SPX at an inflection point, right here. If the trend is still up; the decline stops NOW.

If not, the next break marks a full-blown bear market.
2/7

In the last 48-hours, we are finally starting to see a bond "risk-off" rally.

Since Wednesday peak at 1.90%, the 10-year yield is down 16 basis points (chart).

The 2-year (not shown) traded down less, just 6 bps and the yield curve is flattening again, back to 74 bps. Image
3/7

I take this as a signal that now the bond market is getting "worried" about the stock market, so a risk-off bond rally is underway.

So, we have arrived at an inflection point, which coincides with the SPX breaking the 200d MA for the first time in 409 days Image
Read 6 tweets
Jan 20
1/10

What do markets look like when they are freaking out?

Answer, like they look this week.

Why? The realization/fear that the Fed is going to slam on the brakes ... hard. And the panic that the stock market is going to get thrown through the windshield.

A 🧵to explain
2/10

Let's start with Tuesday (Jan 18). The SPX was down 1.8% the same day the 10-year yield was up 9 basis point.

This has only happened seven times since 2000 Image
3/10

And today

The S&P was up 1.53% at today's high. It closed down more than 1%.

Only 8 times since the Global Financial Crisis in 2009 has the S&P 500 been up more than 1.5% intraday and then finished down more than 1%. And 4 of the 8 were in March 2020 (bolded) Image
Read 11 tweets
Jan 14
1/5
A thread to go over my interpretation of interest rates.

First this is what the market currently has priced in. 36% for the 5th hike in Feb 2023 is the highest ever.

First hike in March is now 86%. At this point any talk of no hike in March would move the market.
2/5

Earlier this morning Mike Wilson of Morgan Stanley was on Bloomberg TV. He is looking for 1.60% on 2-year yields at mid-year (from 0.945%).
3/5

This fits our view that the 10-year minus 2-year curve can invert by mid-year.
Read 6 tweets
Jan 9
1/14

In some respects, what happened in bond markets last week was epic, something we might be talking about for many years.

A thread to explain
2/14

When discussing bond market moves, I believe the best metric is total return. It encompasses both price change and the level of yields (accrued interest).

The next set of charts show calendar week total returns. That is, the week ending Friday (Thursday if a holiday).
3/14

The 30-year data goes back to 1973 and last week was the worst calendar week total return in at least 49-year history! The long-bond lost 9.35%!!

If this was a year, a 9.35% total return loss would be the 5-year worst year ever.

Impressive for five days of work. Image
Read 14 tweets
Jan 6
1/5

Narrative is US cases will peak any day following South Africa pattern.

Keep in mind:

* South Africa is only 30% vaxxed (US 63%)
* It's young with few restrictions
* So, everyone "breathed on each other" cases went up 100x in 30 days and then peaked.
2/5

Why isn't Europe a better model for the US?

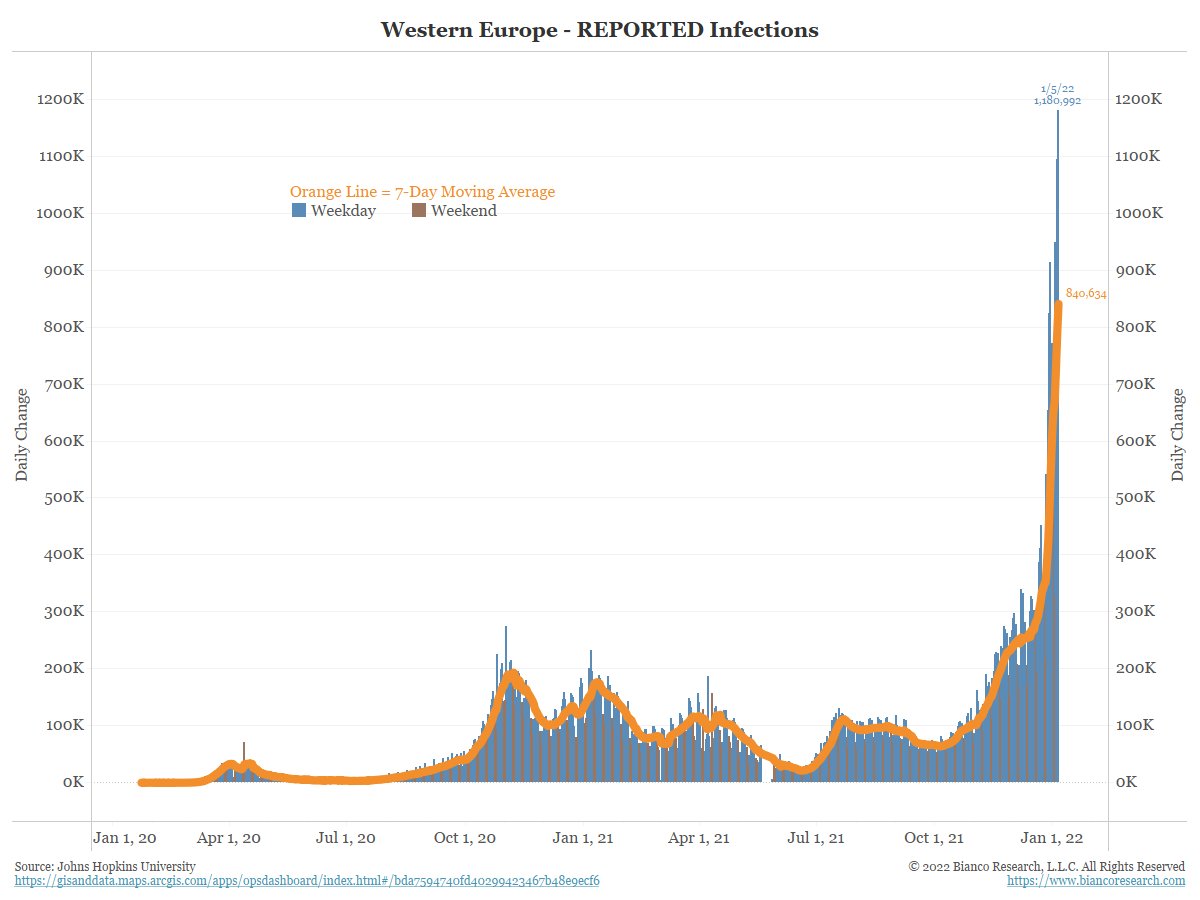
They are trying to prevent spread with restrictions/lockdowns (Dutch). So, they are dragging it out and made another new high yesterday.

EU is not willing to go 100x in 30 days like SA, so they are taking a longer time to peak.
3/5
If the US was indeed following South Africa and going to peak any day, our 7-day positive avg would be about 3M now, not ~600k.

We are trying to slow it down, and it is working!! EU leads the US by 6 weeks. If the EU peaks today, the US peaks in 2H of Feb at the earliest.
Read 5 tweets
Jan 5
1/8

Nothing the Fed said today should have been a surprise.

The problem was the market just did not want to believe it until the minutes came out.

Now it hit them like a brick to the face.

A thread to explain

2/8

The orange line is the probability of a March hike. It has been above 50% since December 21, over 2 weeks now.

The blue line is a June rate hike. That has been priced in since late-Oct.

The Fed minutes should not have been a surprised, it's been priced in for some time.
3/8

For a while I've talked about the disconnect between what the market has priced in and what the consensus says will happen. It is rare the market pricing is NOT the consensus view.
Read 8 tweets

Did Thread Reader help you today?

Support us! We are indie developers!


This site is made by just two indie developers on a laptop doing marketing, support and development! Read more about the story.

Become a Premium Member ($3/month or $30/year) and get exclusive features!

Become Premium

Too expensive? Make a small donation by buying us coffee ($5) or help with server cost ($10)

Donate via Paypal

Or Donate anonymously using crypto!

Ethereum

0xfe58350B80634f60Fa6Dc149a72b4DFbc17D341E copy

Bitcoin

3ATGMxNzCUFzxpMCHL5sWSt4DVtS8UqXpi copy

Thank you for your support!

Follow Us on Twitter!

:(