2/4 Image
3/4
Why do Democrats, who like taxes and want to less fossil fuel consumption to save the planet, want to cut gas taxes?

I can answer it with two charts. ImageImage
4/4

If you are still unsure, try this final chart.

Remember the political bettors are very good at predicting the outcome of elections. Image

• • •

Missing some Tweet in this thread? You can try to force a refresh
 

Keep Current with Jim Bianco biancoresearch.eth

Jim Bianco biancoresearch.eth Profile picture

Stay in touch and get notified when new unrolls are available from this author!

Read all threads

This Thread may be Removed Anytime!

PDF

Twitter may remove this content at anytime! Save it as PDF for later use!

Try unrolling a thread yourself!

how to unroll video
  1. Follow @ThreadReaderApp to mention us!

  2. From a Twitter thread mention us with a keyword "unroll"
@threadreaderapp unroll

Practice here first or read more on our help page!

More from @biancoresearch

Feb 11
1/4

This morning the UM released monthly survey of consumers. To put it bluntly, this was not a good report.

Current level of consumer confidence is below the levels seen in April 2020 when the world was locked down. Its current reading is near levels associated with the GFC.
2/4

Half the country thinks their standard of living is going to fall because of inflation, as explained here.

sca.isr.umich.edu
3/4

This puts the Fed in an impossible position.

* Help the half that sees inflation hurting them by aggressively hiking rates.

* Help those with incomes > $100K by not hiking aggressively in order to prop up stock prices.
Read 4 tweets
Feb 11
1/6

A 🧵 about NYC

bloomberg.com/news/articles/…

“Let this ridership record be a clear signal – New York is coming out of the Omicron surge and we have numbers to prove it,” Governor Kathy Hochul said in a statement Wednesday.
2/6

Subway ridership did make a new one-day post-pandemic peak on Tuesday. But day-to-day subway ridership fluctuates based on the day of the week and weather. So while Tuesday was a record over 3 million, there have been several 2.9 million days in recent weeks.
3/6

Taking a step back, the chart below shows a rolling 7-day average of the three most used ways people commute in New York, driving (bridge and tunnel usage), buses and subway. It is shown as a percentage of the average usage pre-pandemic.
Read 6 tweets
Jan 21
1/7

I typically do not get into the weeds with short term outlooks. But in this 🧵I will make an exception.

I see the SPX at an inflection point, right here. If the trend is still up; the decline stops NOW.

If not, the next break marks a full-blown bear market.
2/7

In the last 48-hours, we are finally starting to see a bond "risk-off" rally.

Since Wednesday peak at 1.90%, the 10-year yield is down 16 basis points (chart).

The 2-year (not shown) traded down less, just 6 bps and the yield curve is flattening again, back to 74 bps.
3/7

I take this as a signal that now the bond market is getting "worried" about the stock market, so a risk-off bond rally is underway.

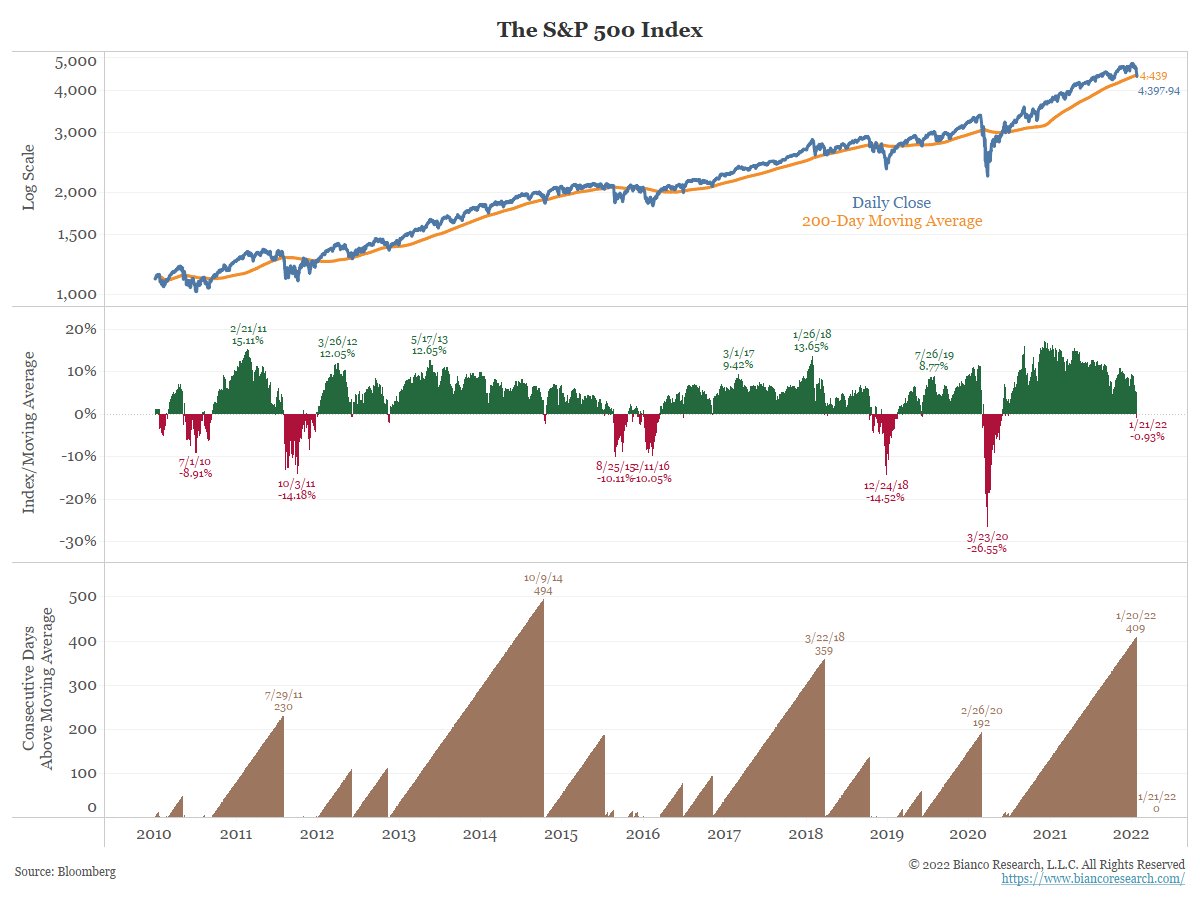
So, we have arrived at an inflection point, which coincides with the SPX breaking the 200d MA for the first time in 409 days
Read 6 tweets
Jan 21
1/3

Powell might not be chairman in 2 weeks, and it will not matter.

Sherrod Brown (D, OH), the head of the Senate finance committee, said the committee will most likely vote on the Powell/Brainard nominations in early Feb.
No date on the full Senate floor confirmation vote.
2/3

Powell's term as Fed Chairman ends January 31. His term as a "regular" Fed governor expires in 2028.

(The Fed chairman is also a "regular" Fed Governor, think of them as two separate things)
3/3

Brown told the press yesterday it doesn't matter that Powell technically expires as Chairman on the 31st.

All parties will probably agree to treat him as the Fed Chairman, and everything continues as is.

Your dysfunctional Government making things up.

@DiMartinoBooth
Read 7 tweets
Jan 20
1/10

What do markets look like when they are freaking out?

Answer, like they look this week.

Why? The realization/fear that the Fed is going to slam on the brakes ... hard. And the panic that the stock market is going to get thrown through the windshield.

A 🧵to explain
2/10

Let's start with Tuesday (Jan 18). The SPX was down 1.8% the same day the 10-year yield was up 9 basis point.

This has only happened seven times since 2000 Image
3/10

And today

The S&P was up 1.53% at today's high. It closed down more than 1%.

Only 8 times since the Global Financial Crisis in 2009 has the S&P 500 been up more than 1.5% intraday and then finished down more than 1%. And 4 of the 8 were in March 2020 (bolded) Image
Read 11 tweets
Jan 14
1/5
A thread to go over my interpretation of interest rates.

First this is what the market currently has priced in. 36% for the 5th hike in Feb 2023 is the highest ever.

First hike in March is now 86%. At this point any talk of no hike in March would move the market.
2/5

Earlier this morning Mike Wilson of Morgan Stanley was on Bloomberg TV. He is looking for 1.60% on 2-year yields at mid-year (from 0.945%).
3/5

This fits our view that the 10-year minus 2-year curve can invert by mid-year.
Read 6 tweets

Did Thread Reader help you today?

Support us! We are indie developers!


This site is made by just two indie developers on a laptop doing marketing, support and development! Read more about the story.

Become a Premium Member ($3/month or $30/year) and get exclusive features!

Become Premium

Don't want to be a Premium member but still want to support us?

Make a small donation by buying us coffee ($5) or help with server cost ($10)

Donate via Paypal

Or Donate anonymously using crypto!

Ethereum

0xfe58350B80634f60Fa6Dc149a72b4DFbc17D341E copy

Bitcoin

3ATGMxNzCUFzxpMCHL5sWSt4DVtS8UqXpi copy

Thank you for your support!

:(