Timothée Parrique Profile picture
Feb 16 • 14 tweets • 5 min read
Another spectacular empirical study on unequal exchange by @jasonhickel, @C_Dorninger, Hanspeter Wieland, and Intan Suwandi.

🧵
The article is looking for evidence of something called "unequal exchange." (For more: compass.onlinelibrary.wiley.com/doi/abs/10.111…)
Finding: there is a net flow of resources from the global South to the global North. For example, for every unit of labour that the South imports from the North, they have to export on average 13 units to pay for it.
This is true for labour but also for materials, energy, and land.
In the year 2015, the North's net appropriation from the South totalled 12 billion tons of materials, 822 million hectares of land, 21 exajoules of energy, and 392 billion hours of work.
All these resources that are appropriated by the North cannot be used in the South.
So the North gets free resources, uses it, and then exports damages, for example by warming the climate (more than 90% of the costs of climate change are suffered by the South).
Time to put some money figures on this appropriation. In 2015, the North appropriated $10.8 trillion of resources from the South. (The cumulated amount over the whole period is $242 trillion.)
This is a lot.
Another way to look at it (this time with 'global prices' instead of 'Northern prices'), but same pattern: the North imports cheap and exports dear.
In global average prices, the drain over the 1990-2015 period amounts to $84 trillions.
This appropriation represents 24% of the North's GDP and 23% of the South's GDP.
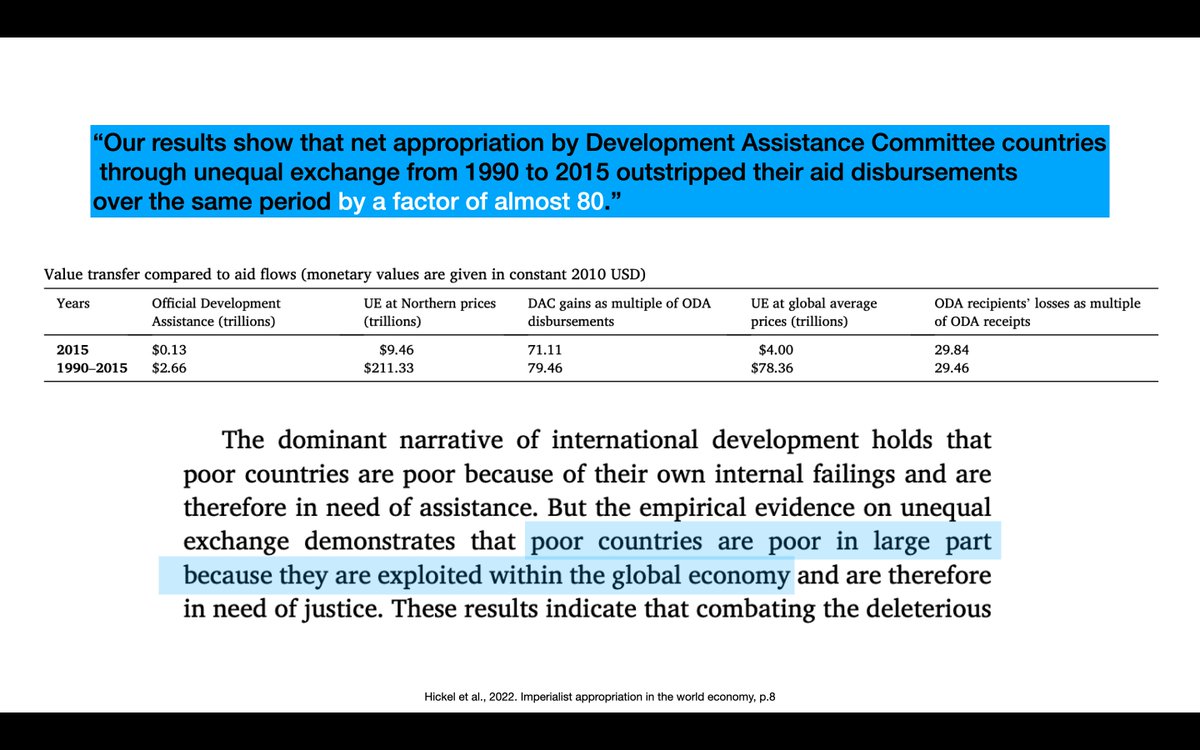
If you foreign aid will eradicate poverty? Think again. For every dollar of aid that donors give, they appropriate resources worth $80 through unequal exchange.
This is one of three recent papers on the topic. Here are summary threads for the two others.
1)
2)

And the link to the paper:
sciencedirect.com/science/articl…!

• • •

Missing some Tweet in this thread? You can try to force a refresh
 

Keep Current with Timothée Parrique

Timothée Parrique Profile picture

Stay in touch and get notified when new unrolls are available from this author!

Read all threads

This Thread may be Removed Anytime!

PDF

Twitter may remove this content at anytime! Save it as PDF for later use!

Try unrolling a thread yourself!

how to unroll video
  1. Follow @ThreadReaderApp to mention us!

  2. From a Twitter thread mention us with a keyword "unroll"
@threadreaderapp unroll

Practice here first or read more on our help page!

More from @timparrique

Feb 18
18 tips to make your company look green (even though it’s not).

🧵
This is based on the Corporate Climate Responsibility Monitor 2022, which has assessed the climate strategies of 25 major global companies.

newclimate.org/2022/02/07/cor…
The study has identified 18 "bad practices" through which companies make themselves look greener than they actually are. Here are all of them.
Read 21 tweets
Feb 7
Here is an indispensable piece of work to understand the global dynamics of environmental pressures. Thomas Wiedmann & Manfred Lenzen in @NatureGeosci.

🧵
In a globalised economy, many processes of production scatter through complex, international supply chains. To calculate the footprint of one single country, one must keep track of all the impacts its consumption has abroad.
This article is a review of the empirical literature that has looked at the environmental and social impacts embodied in international trade.
Read 11 tweets
Feb 3
An interesting article by @JPTilsted et al. on the "green" growth of Nordic countries (that is actually not as green as you may have heard).

🧵 Image
The article criticises the concept of "Genuine Green Growth" from @estoknes and @jrockstrom arguing that the growth of Nordic countries is not as genuine and green as it seems. Image
In the Stoknes & Rockström paper, the authors show that the emission patterns of Nordic countries sometime meets the green growth requirement of a yearly 5% improvement in carbon productivity (the straight blue line). Image
Read 11 tweets
Jan 31
One of my favourite papers of 2021: "The social shortfall and ecological overshoot of nations" by @AndrewLFanning, @DrDanONeill, @jasonhickel, and Nicolas Roux.

🧵
The paper looks at 11 social and 6 environmental indicators for 140 countries between 1992 and 2015. It also models 'business-as-usual' projections up to 2050.
This donut-shaped figure shows which ecological boundaries are transgressed: the 'OVERSHOOT' (the red bits outward), and which social foundations are unreached: the 'SHORTFALL" (the red bits inward).
Read 11 tweets
Jan 28
Important numbers about inequalities in flying.

THREAD
If the right to fly was equally divided among everyone, this would give us 0.6 flights per year.
Of course it is not. In fact, only very few people flies.
Read 9 tweets
Jan 26
Latest numbers on carbon inequality by @lucas_chancel.

THREAD
Close to half of all emissions since the industrial revolution have been produced since 1990, the year of the first report by the Intergovernmental Panel on Climate Change (IPCC).
At current global emissions rates, the 1.5°C budget will be depleted in 6 years and the 2°C budget in 18 years. The per capita sustainable budget compatible with the 1.5°C limit is 1.1 tonne of CO2 per annum per person, i.e. about 6 times less than the current global average.
Read 18 tweets

Did Thread Reader help you today?

Support us! We are indie developers!


This site is made by just two indie developers on a laptop doing marketing, support and development! Read more about the story.

Become a Premium Member ($3/month or $30/year) and get exclusive features!

Become Premium

Don't want to be a Premium member but still want to support us?

Make a small donation by buying us coffee ($5) or help with server cost ($10)

Donate via Paypal

Or Donate anonymously using crypto!

Ethereum

0xfe58350B80634f60Fa6Dc149a72b4DFbc17D341E copy

Bitcoin

3ATGMxNzCUFzxpMCHL5sWSt4DVtS8UqXpi copy

Thank you for your support!

:(