Complete Guide to Swing Trading
A Mega Thread 🧵
With Live Charts and Examples
Comment " Yes " and Retweet if You want PDF version
A Mega Thread 🧵
With Live Charts and Examples
Comment " Yes " and Retweet if You want PDF version

Criteria for Swing Trading :
Uptrend HH HL Structure
Stage 2 Uptrend
Volume Expansion during Breakout
Pullbacks with Lower Volume
Base Formation ( Rectangle , Vcp Etc)
Relative Strength > 0
21 ema > 50 ema > 200 ema
Stocks near 52 week High
Stocks near All time High
1/n
Uptrend HH HL Structure
Stage 2 Uptrend
Volume Expansion during Breakout
Pullbacks with Lower Volume
Base Formation ( Rectangle , Vcp Etc)
Relative Strength > 0
21 ema > 50 ema > 200 ema
Stocks near 52 week High
Stocks near All time High
1/n
What is HH HL Structure ?
1. A stock Maintains Bullish Momentum till it holds the last Swing .
2. Swings is an area from where stock reverses
3. As it is widely known Trend is your Friend A structure of Higher High is good for buying as overall momentum is in buying side
3/n
1. A stock Maintains Bullish Momentum till it holds the last Swing .
2. Swings is an area from where stock reverses
3. As it is widely known Trend is your Friend A structure of Higher High is good for buying as overall momentum is in buying side
3/n

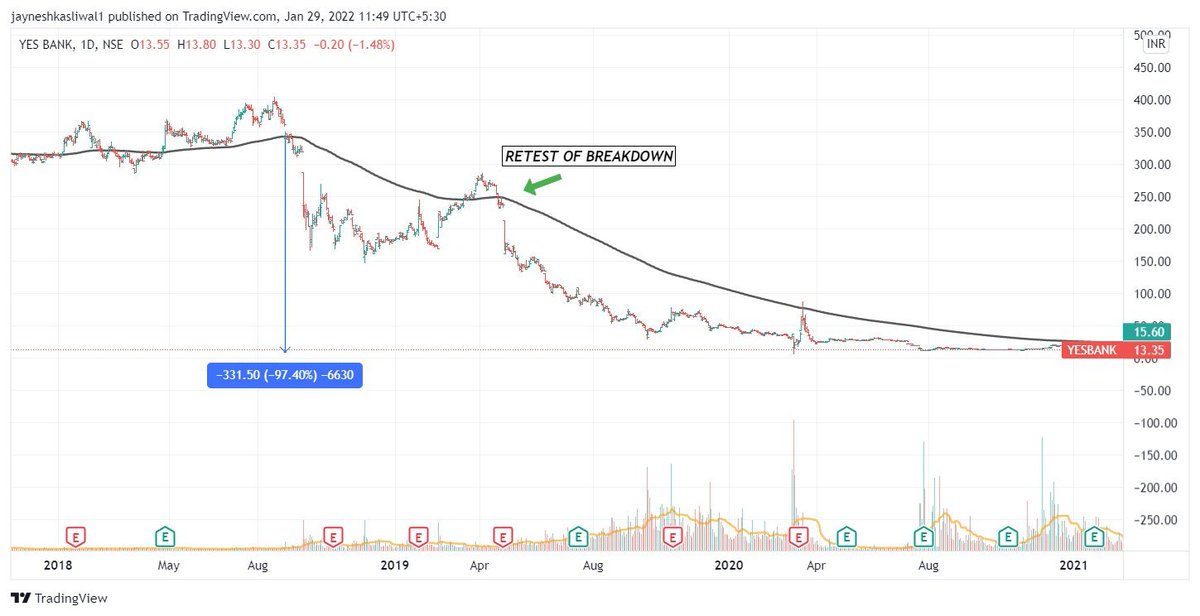
A structure of Lower Highs is good for selling side , as each bounces will be sold off
Previous Swings will now act as Resistance in Downtrend and Support in Uptrend
4/n

Previous Swings will now act as Resistance in Downtrend and Support in Uptrend
4/n


Enter Stage 2 Uptrend
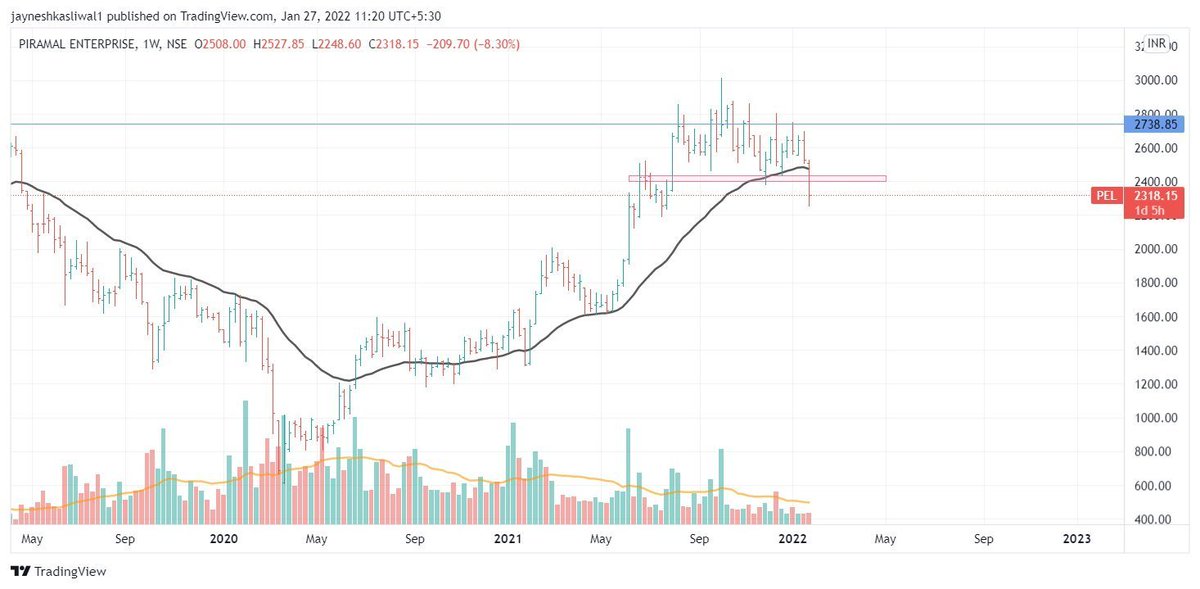
Stage 2: The Ideal Buy Point for Traders Traders should look for bases within an existing Stage 2 uptrend and focus on breakouts on volume. Intermediate term traders can also use investor buy points
5/n
Stage 2: The Ideal Buy Point for Traders Traders should look for bases within an existing Stage 2 uptrend and focus on breakouts on volume. Intermediate term traders can also use investor buy points
5/n

Traits in Stage 2 Breakout above the resistance zone & 30 week MA on big volume Post initial breakout, there is usually a retest of the breakout point 30 week MA starts turning up shortly after the breakout
6/n


6/n


Read More About Stage Analysis
7/n
https://twitter.com/JayneshKasliwal/status/1492721206969061380?t=gxVZ0JAS5GLSqu9Q9hgUzA&s=19
7/n
Volume Expansion on breakout :
Volume Plays an important Role in Sucess of Breakout.
If Breakouts occur on Low Volumes its is likely to Fail , But breakdowns can happen on Low Volumes
Pic :Distribution to be looked at top of trend
8/n


Volume Plays an important Role in Sucess of Breakout.
If Breakouts occur on Low Volumes its is likely to Fail , But breakdowns can happen on Low Volumes
Pic :Distribution to be looked at top of trend
8/n


Pullback with less volumes
Low volume pullbacks are often a sign of weak longs taking profit, but suggest that the long-term uptrend remains intact.
High volume pullbacks suggest that there could be a near-term reversal.
9/n

Low volume pullbacks are often a sign of weak longs taking profit, but suggest that the long-term uptrend remains intact.
High volume pullbacks suggest that there could be a near-term reversal.
9/n


Base Formation
Basing refers to a consolidation in the price
Basing periods are accompanied by declining volume and there is an equilibrium between supply and demand.
It could be rectangle base , Cup and Handle Base or Volatilty contraction pattern
12/n


Basing refers to a consolidation in the price
Basing periods are accompanied by declining volume and there is an equilibrium between supply and demand.
It could be rectangle base , Cup and Handle Base or Volatilty contraction pattern
12/n


Relative Strength
Relative strength is a strategy used in momentum investing and in identifying value stocks.
It focuses on investing in stocks or other investments that have performed well relative to the market as a whole or to a relevant benchmark.
13/n
Relative strength is a strategy used in momentum investing and in identifying value stocks.
It focuses on investing in stocks or other investments that have performed well relative to the market as a whole or to a relevant benchmark.
13/n
Type
“Relative Strength”
Choose any
By bharattrader
By traderlion
By Modhelius
I use by bharattrader
In setting use 65 period for 3 months of Trading
14/n
“Relative Strength”
Choose any
By bharattrader
By traderlion
By Modhelius
I use by bharattrader
In setting use 65 period for 3 months of Trading
14/n

0 line that helps to differentiate between underperformer and outperformer
>1 Outperforming the markets
<0 Underperforming the markets
When RS Goes above 2 its too much heated and generally goes into consolidation.
15/n

>1 Outperforming the markets
<0 Underperforming the markets
When RS Goes above 2 its too much heated and generally goes into consolidation.
15/n


Select Stocks where RS Line is postive and continously outperforming
These stocks tend to outperform in strong and weak markets
So stick to selecting stocks that are outperforming where RS line is Postive
Read More on RS :
16/n
These stocks tend to outperform in strong and weak markets
So stick to selecting stocks that are outperforming where RS line is Postive
Read More on RS :
https://twitter.com/JayneshKasliwal/status/1480449068891455488?s=20&t=3trilrPKVKDu98T8phKpvw
16/n
Role of emas
21>50>200 ema
Signifies Strong Uptrend
Moving Averages plot the Avg price which will help us identify the overall trend
These Avgs give Dynamic Support to price and hence price bounces off these emas
17/n

21>50>200 ema
Signifies Strong Uptrend
Moving Averages plot the Avg price which will help us identify the overall trend
These Avgs give Dynamic Support to price and hence price bounces off these emas
17/n


Whenever 21 ema is sloping upwards its called uptrend
Whenever 21 ema is sloping downwards its called dowtrend
Whenever 21 ema is sideways its called consolidation
Buy in uptrend
Sell in downtrend
18/n

Whenever 21 ema is sloping downwards its called dowtrend
Whenever 21 ema is sideways its called consolidation
Buy in uptrend
Sell in downtrend
18/n


More About Moving AVGs:
19/n
https://twitter.com/JayneshKasliwal/status/1465601681190645761?s=20&t=3trilrPKVKDu98T8phKpvw
19/n
52 WEEK high Stocks :
Stocks near 52 week high have a lot of demand
We basically want stocks that are in demand where prices keep going up
Buy High Sell Higher should be thinking in Swing trading
Screener : 52 week breakout Stocks chartink.com/screener/copy-…
20/n
Stocks near 52 week high have a lot of demand
We basically want stocks that are in demand where prices keep going up
Buy High Sell Higher should be thinking in Swing trading
Screener : 52 week breakout Stocks chartink.com/screener/copy-…
20/n
SWING TRADING MENTORSHIP :
Don't waste This Dip to Buy Multibagger Stocks !✅Mentorship starting in mid March on weekends only .
✅Covering Stage Analysis ,Relative Strength,Moving Average and How to find Super Stocks and more ...
LINK FOR ENQUIRY:
wa.link/si4jn4
Don't waste This Dip to Buy Multibagger Stocks !✅Mentorship starting in mid March on weekends only .
✅Covering Stage Analysis ,Relative Strength,Moving Average and How to find Super Stocks and more ...
LINK FOR ENQUIRY:
wa.link/si4jn4

Follow @JayneshKasliwal For More Such Trading Techniques and Join Telegram :
t.me/Techno_Charts
Retweet anf Comment " Yes " for PDF
t.me/Techno_Charts
Retweet anf Comment " Yes " for PDF
drive.google.com/drive/folders/…
DRIVE LINK FOR
Pdf made by @JayneshKasliwal
Open Folder: Educational Pdfs
Name : Complete Guide to Swing Trading
More than 15+ Pdfs shared
Retweet And Share
// End //
DRIVE LINK FOR
Pdf made by @JayneshKasliwal
Open Folder: Educational Pdfs
Name : Complete Guide to Swing Trading
More than 15+ Pdfs shared
Retweet And Share
// End //
• • •
Missing some Tweet in this thread? You can try to
force a refresh


