1/5
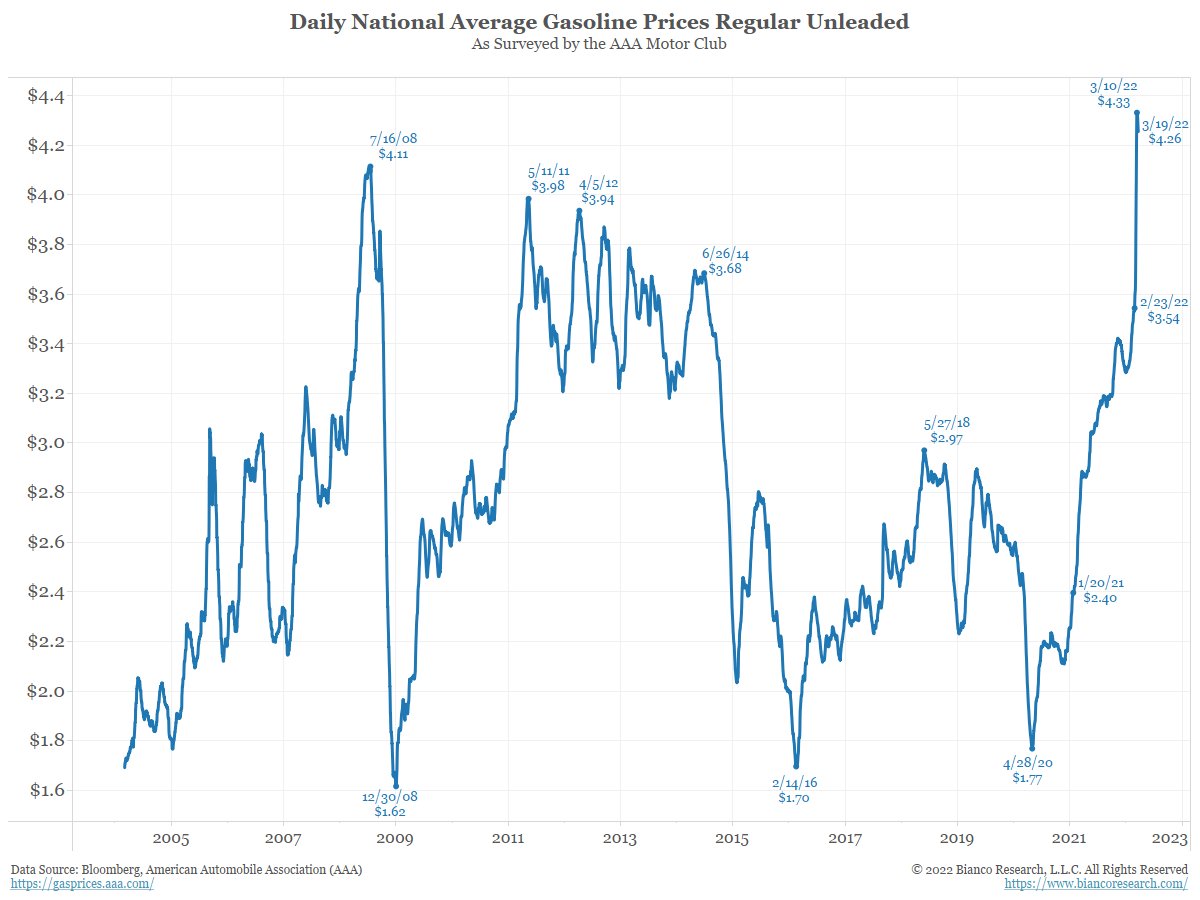
War began Feb 24. To Mar 10, the natl avg of gas prices shot up a record $0.79 over 15 days to a new all-time high of $4.33.
As of y'day it backed off just $0.07 from this peak to $4.26.
And Mar 18 gas prices were down just $0.01, and unchanged on Mar 19.
Decline over?
War began Feb 24. To Mar 10, the natl avg of gas prices shot up a record $0.79 over 15 days to a new all-time high of $4.33.
As of y'day it backed off just $0.07 from this peak to $4.26.
And Mar 18 gas prices were down just $0.01, and unchanged on Mar 19.
Decline over?
2/5
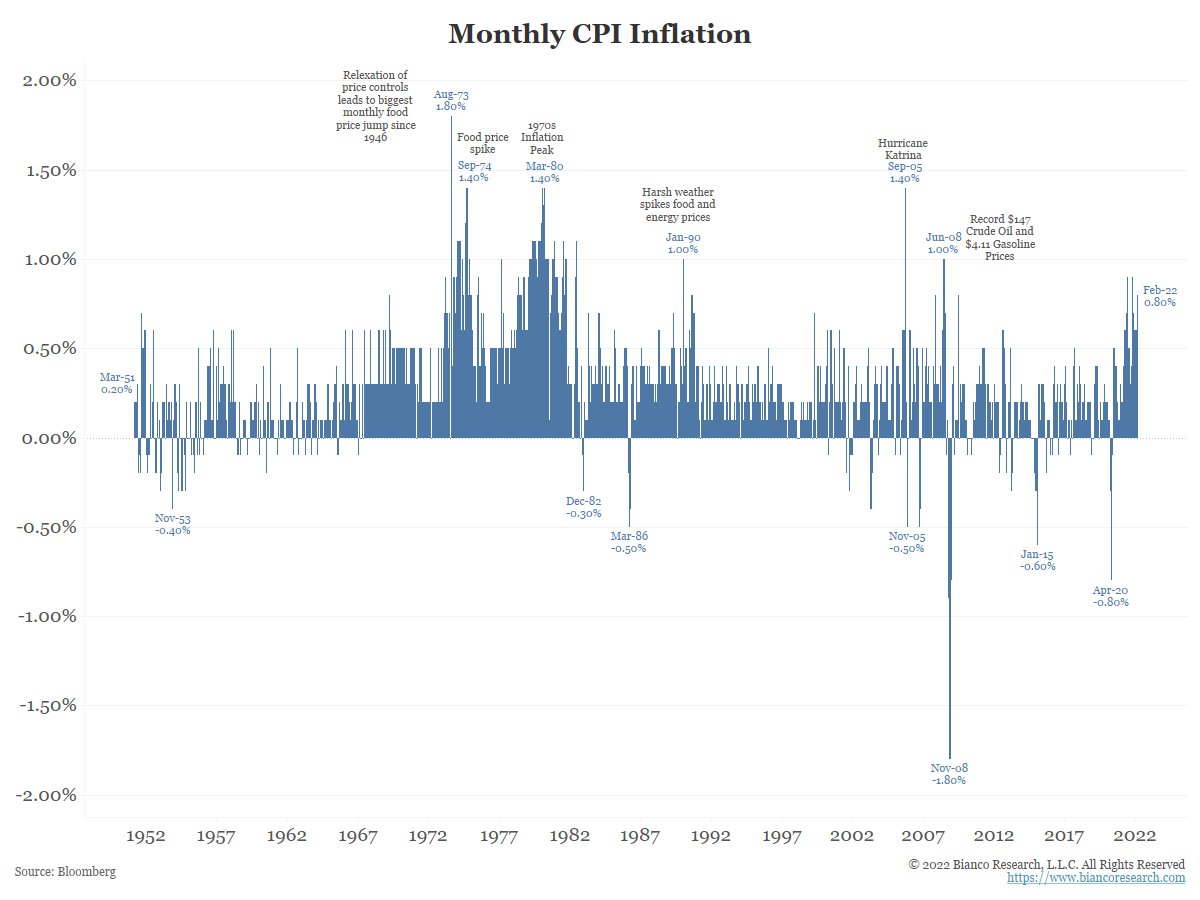
Sept 2005 gas prices rose $0.46, when Hurricane Katrina broke infrastructure along the gulf coast.
The result was a 1.4% Sept 2005 CPI, tying the second biggest month in the last 70 years.
Sept 2005 gas prices rose $0.46, when Hurricane Katrina broke infrastructure along the gulf coast.
The result was a 1.4% Sept 2005 CPI, tying the second biggest month in the last 70 years.
3/5
The month is not over but we still have a 70+ cent rise in gas prices, booming food prices and core inflation beginning the month at a 40-year high.
All this suggest March CPI could be one of the biggest monthly CPIs in our lifetime and launch the YoY CPI to 9%.
The month is not over but we still have a 70+ cent rise in gas prices, booming food prices and core inflation beginning the month at a 40-year high.
All this suggest March CPI could be one of the biggest monthly CPIs in our lifetime and launch the YoY CPI to 9%.
4/5
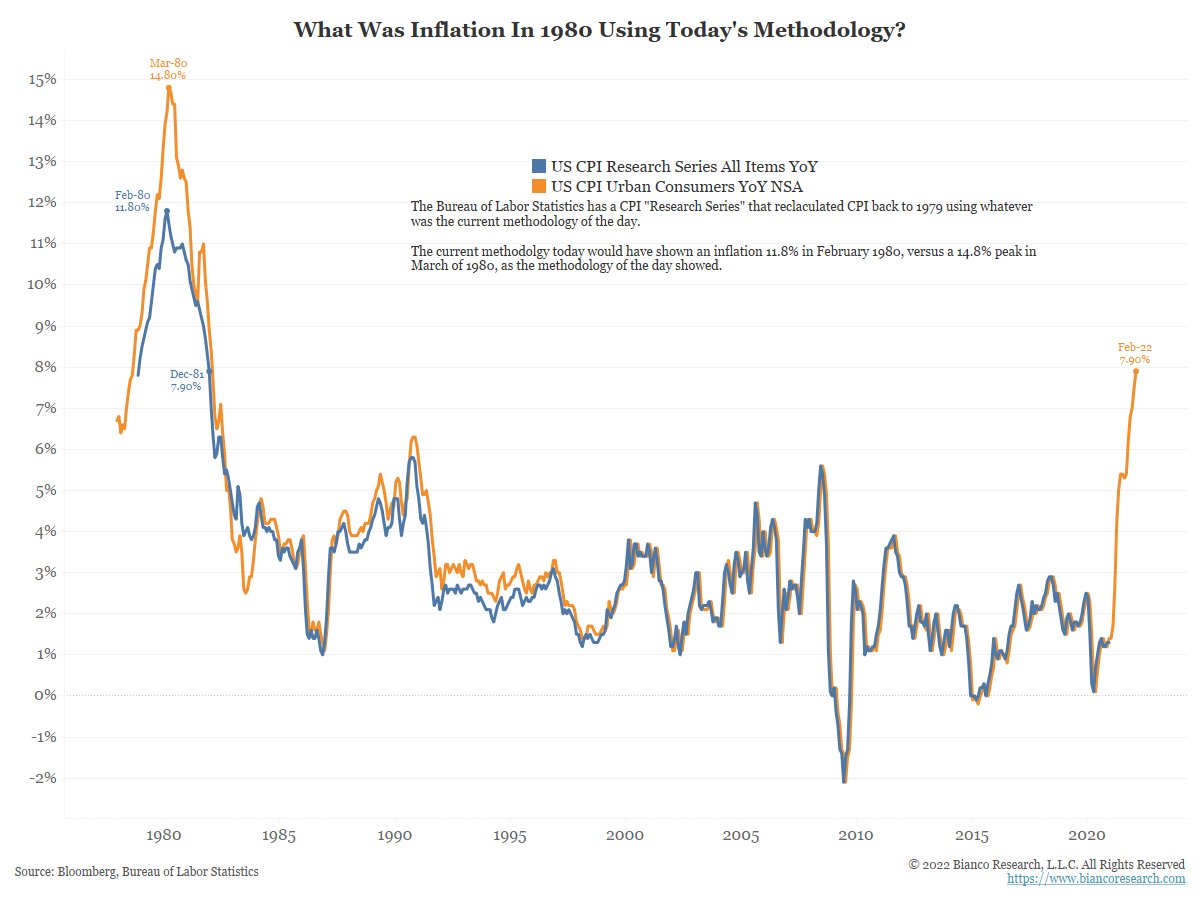
The BLS has a "research series" of CPI. It recalculates CPI back to 1979 using today's methodology.
This means the 1980 peak, again calculating it like we do today, was just 11.5% (blue) versus the 14.8% reported at the time (orange).
The BLS has a "research series" of CPI. It recalculates CPI back to 1979 using today's methodology.
This means the 1980 peak, again calculating it like we do today, was just 11.5% (blue) versus the 14.8% reported at the time (orange).
5/5
Should we indeed see this monster March CPI print, then the discussion as to whether 2022 can actually exceed the 1980 peak inflation reading can ramp up to a serious idea.
Remember just a few months ago when inflation was transitory?
Should we indeed see this monster March CPI print, then the discussion as to whether 2022 can actually exceed the 1980 peak inflation reading can ramp up to a serious idea.
Remember just a few months ago when inflation was transitory?
• • •
Missing some Tweet in this thread? You can try to
force a refresh