Powell
If we conclude that it is approp to move more aggressively by raising the funds rate by more than 25 bps at a meeting or meetings, we will do so
if we determine that we need to tighten beyond measures of neutral into a more restrictive stance, we will do that as well.”
If we conclude that it is approp to move more aggressively by raising the funds rate by more than 25 bps at a meeting or meetings, we will do so
if we determine that we need to tighten beyond measures of neutral into a more restrictive stance, we will do that as well.”
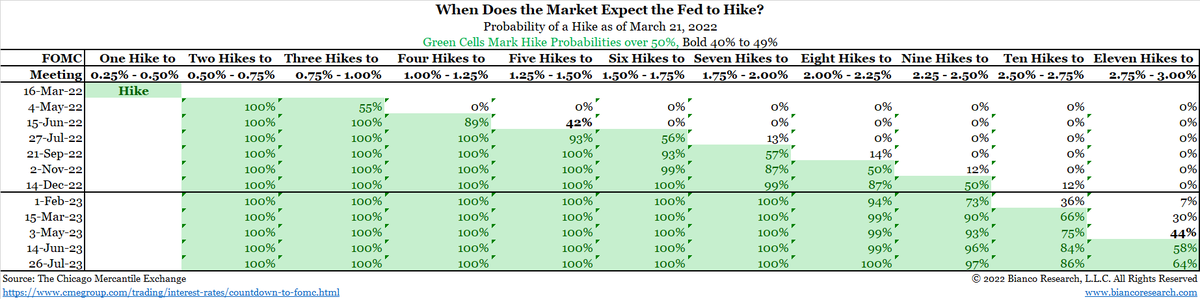
Post Powell speech release:
50bps hike in May 4 now 55%
42% of another 50 in June 15.
Now nine hikes priced in for 2022.
50bps hike in May 4 now 55%
42% of another 50 in June 15.
Now nine hikes priced in for 2022.
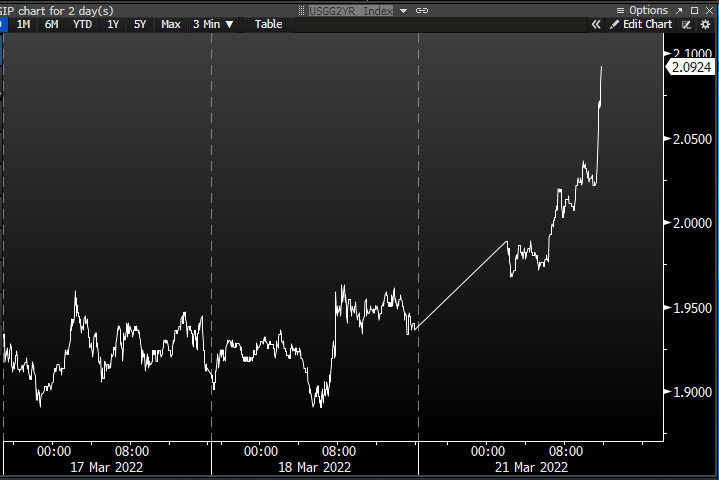
2-year spiking big. Now at 2.10% to up 17bps
10y/2y curve now 17 bps
10y/2y curve now 17 bps
Powell will take Q&A after he is done reading his speech
But for now, it appears that last Wednesday's presser was Powell describing the committee's view. That was viewed as more dovish.
Today we are getting Powell's personal view. This is sounding a lot more hawkish.
But for now, it appears that last Wednesday's presser was Powell describing the committee's view. That was viewed as more dovish.
Today we are getting Powell's personal view. This is sounding a lot more hawkish.
• • •
Missing some Tweet in this thread? You can try to
force a refresh