1/8
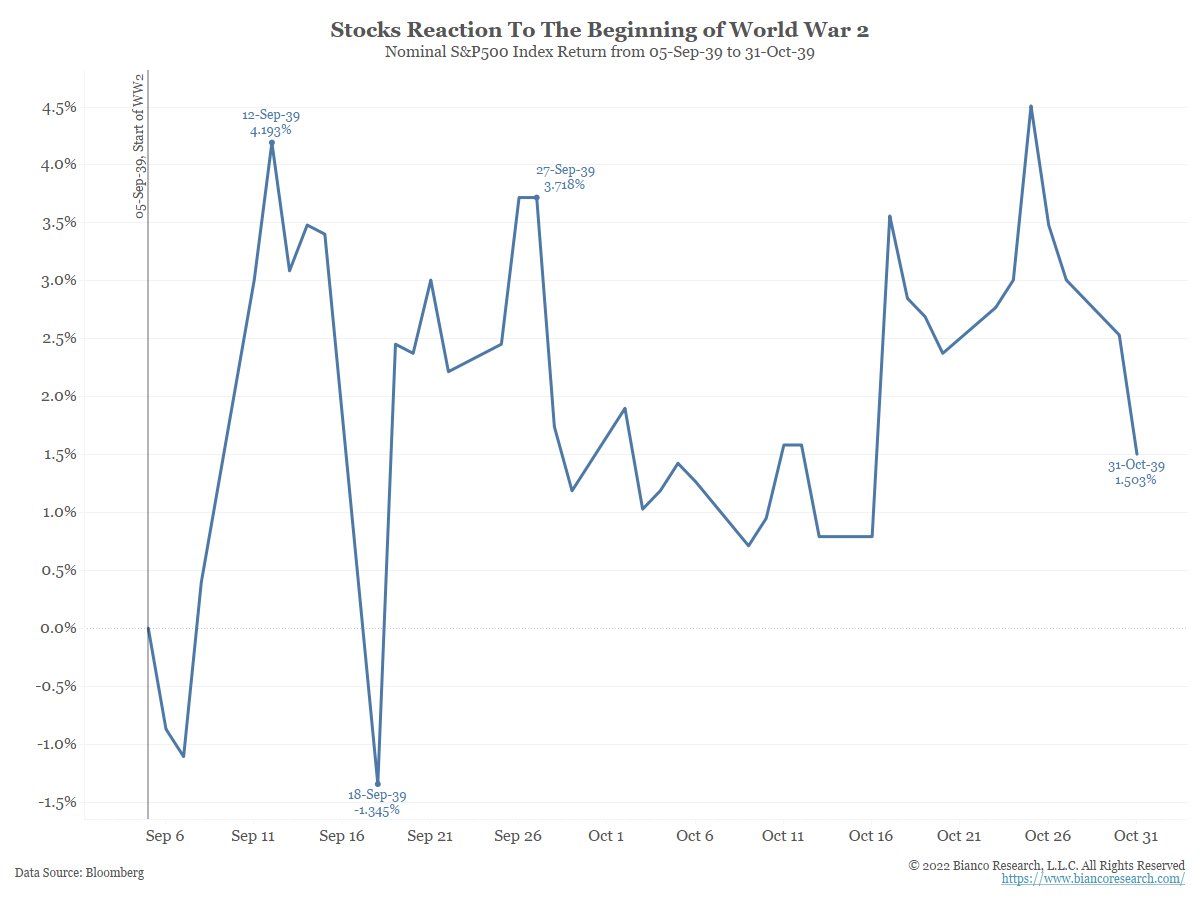
Here is a more complete 🧵on market reactions to world wars.
While @dailydirtnap is suggesting that the market rally is surprising, the same thing happened at the beginning of WW2 (after Sept 1, 1939)

Here is a more complete 🧵on market reactions to world wars.
While @dailydirtnap is suggesting that the market rally is surprising, the same thing happened at the beginning of WW2 (after Sept 1, 1939)
https://twitter.com/dailydirtnap/status/1505931889235927040?s=20&t=YtpJO2yCc98dtPCMiDtpvA
2/8
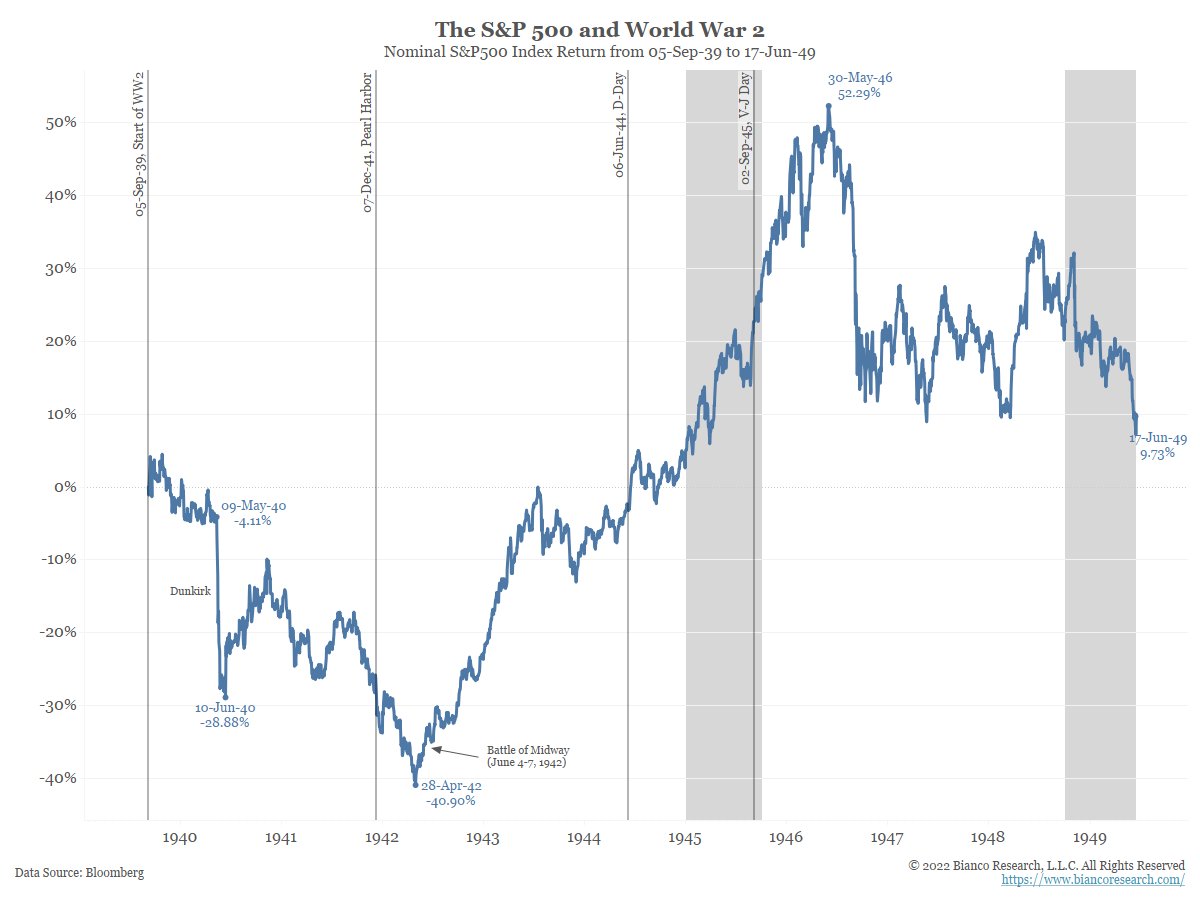
But hope was soon dashed. Stocks fell 40% by April 1942. The victory at Midway turned around the war, and the markets.
Note one of the darkest periods was May 1940, Dunkirk, and the fear the Nazis would win. One of the worst months for stocks in the 20th century.
But hope was soon dashed. Stocks fell 40% by April 1942. The victory at Midway turned around the war, and the markets.
Note one of the darkest periods was May 1940, Dunkirk, and the fear the Nazis would win. One of the worst months for stocks in the 20th century.
3/8
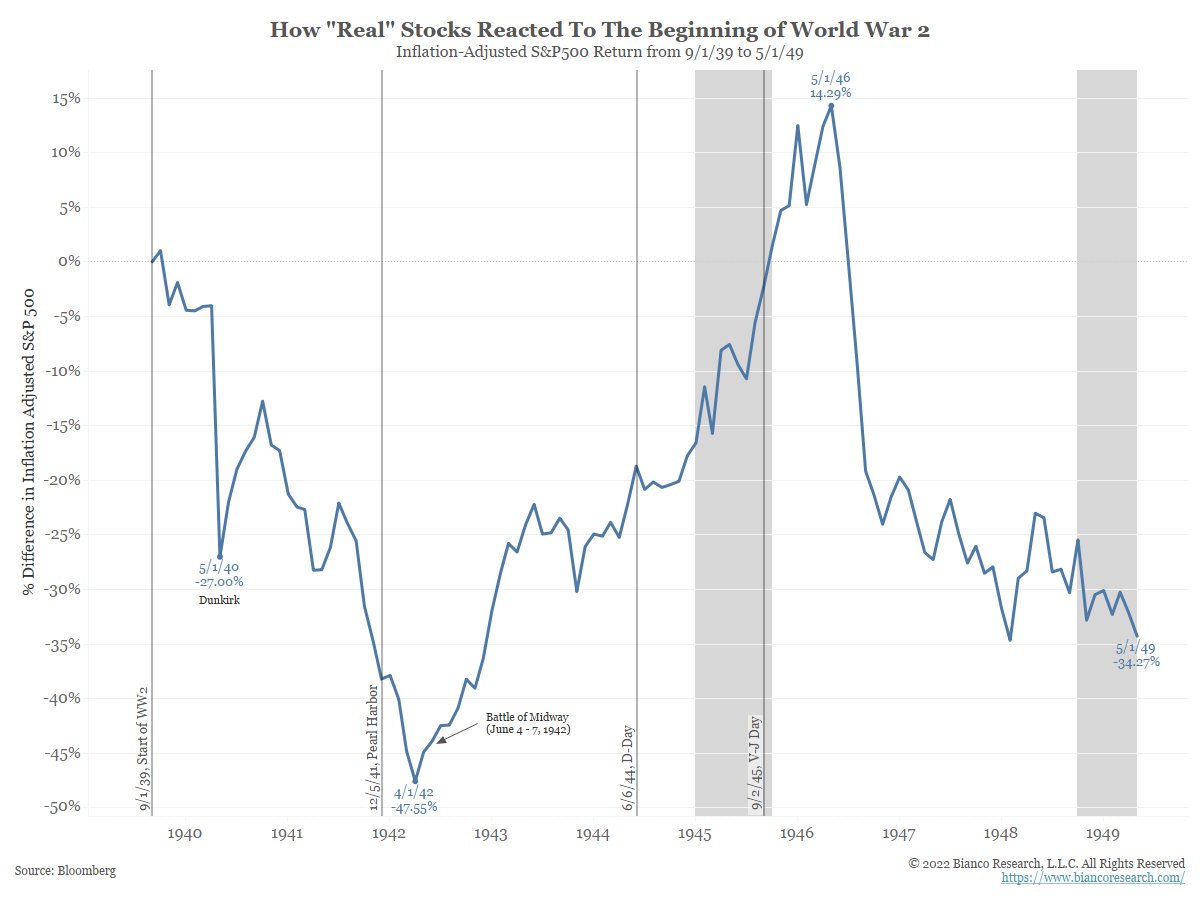
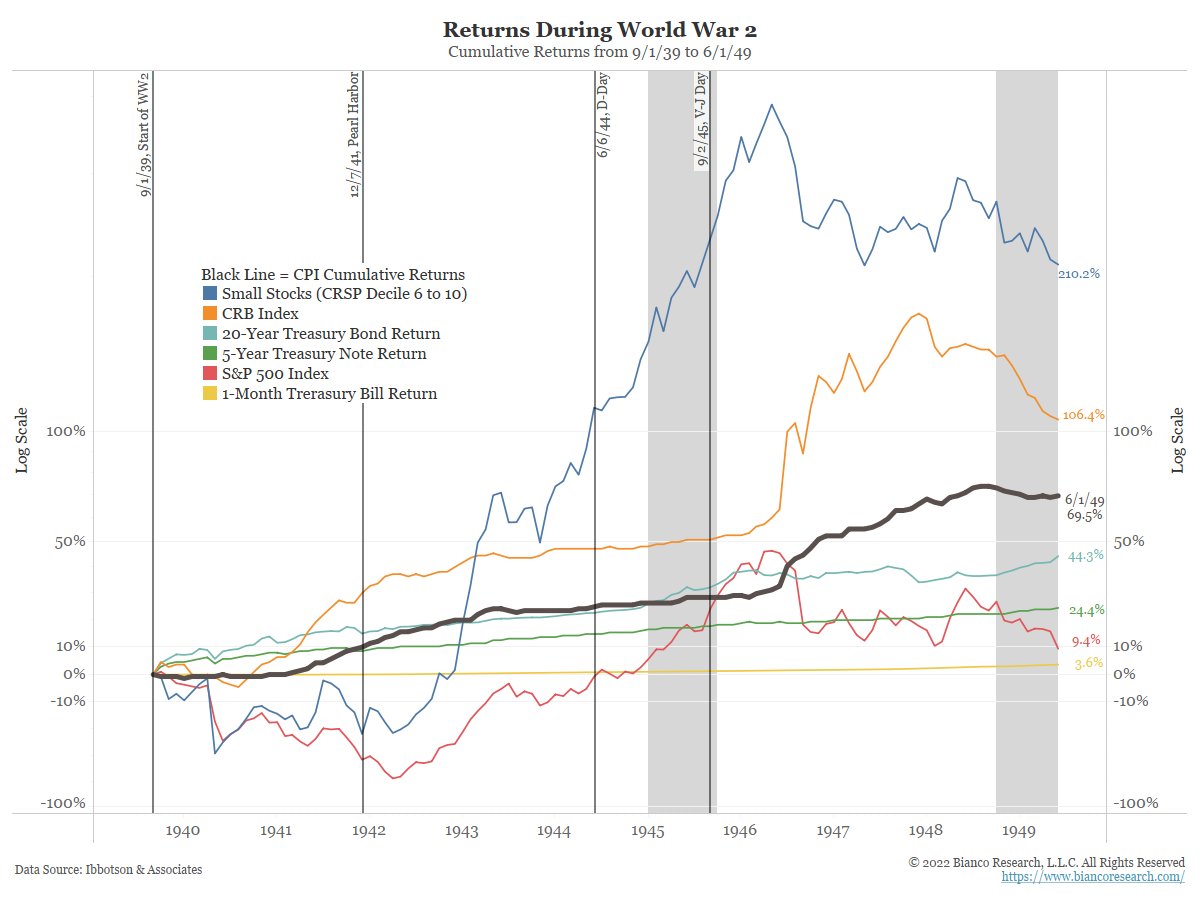
While stocks look like they did well during WW2, up about 40% during the war, inflation was such a big problem that they underperformed the CPI for a decade.
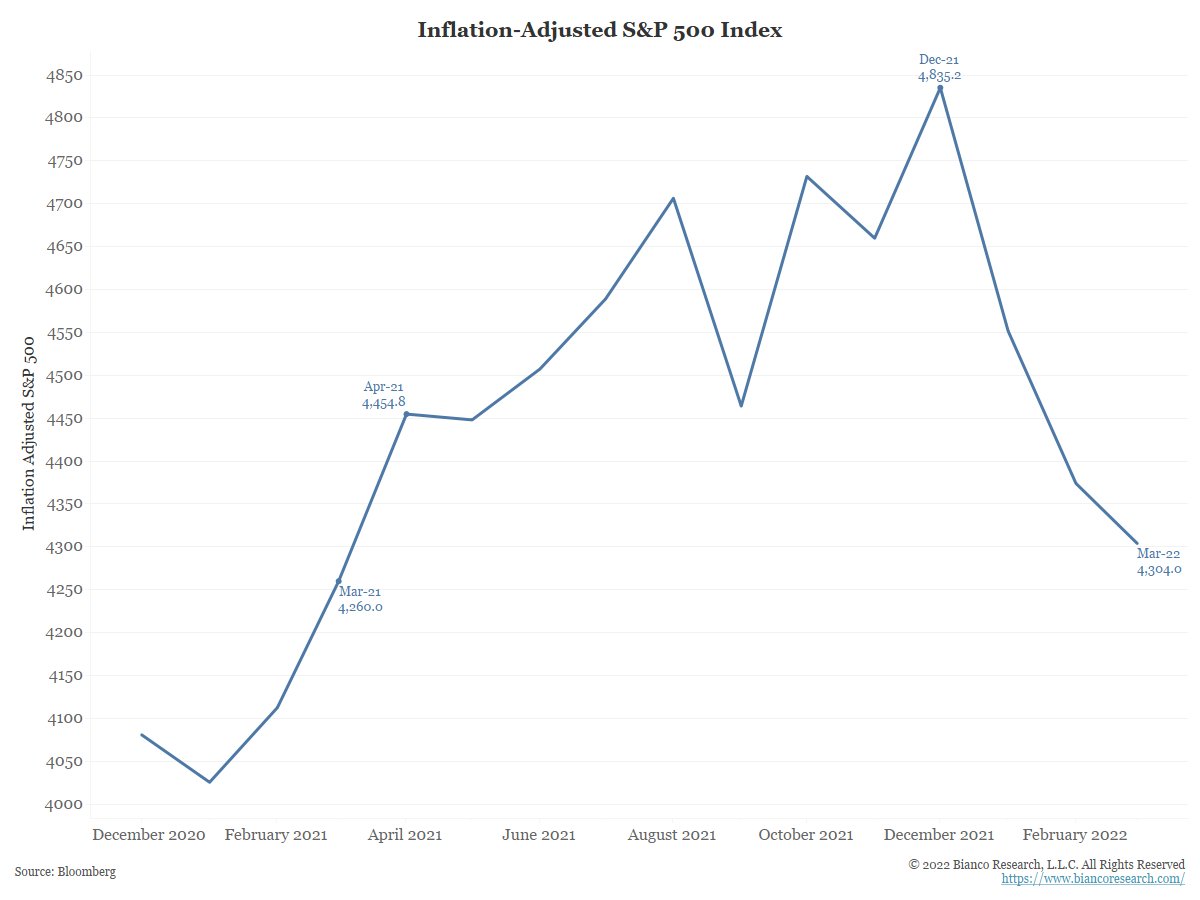
The "real," or inflation-adjusted SPX lost.
While stocks look like they did well during WW2, up about 40% during the war, inflation was such a big problem that they underperformed the CPI for a decade.
The "real," or inflation-adjusted SPX lost.
4/8
This can be seen here. The only things to beat CPI during WW2 was the CRB and small stocks (the WW2 version of Ark!).
Note that in the 1940s, ETF or index funds did not exist. Buying small stocks was incredibly hard, like buying individual emerging/frontier stocks today.
This can be seen here. The only things to beat CPI during WW2 was the CRB and small stocks (the WW2 version of Ark!).
Note that in the 1940s, ETF or index funds did not exist. Buying small stocks was incredibly hard, like buying individual emerging/frontier stocks today.
5/8
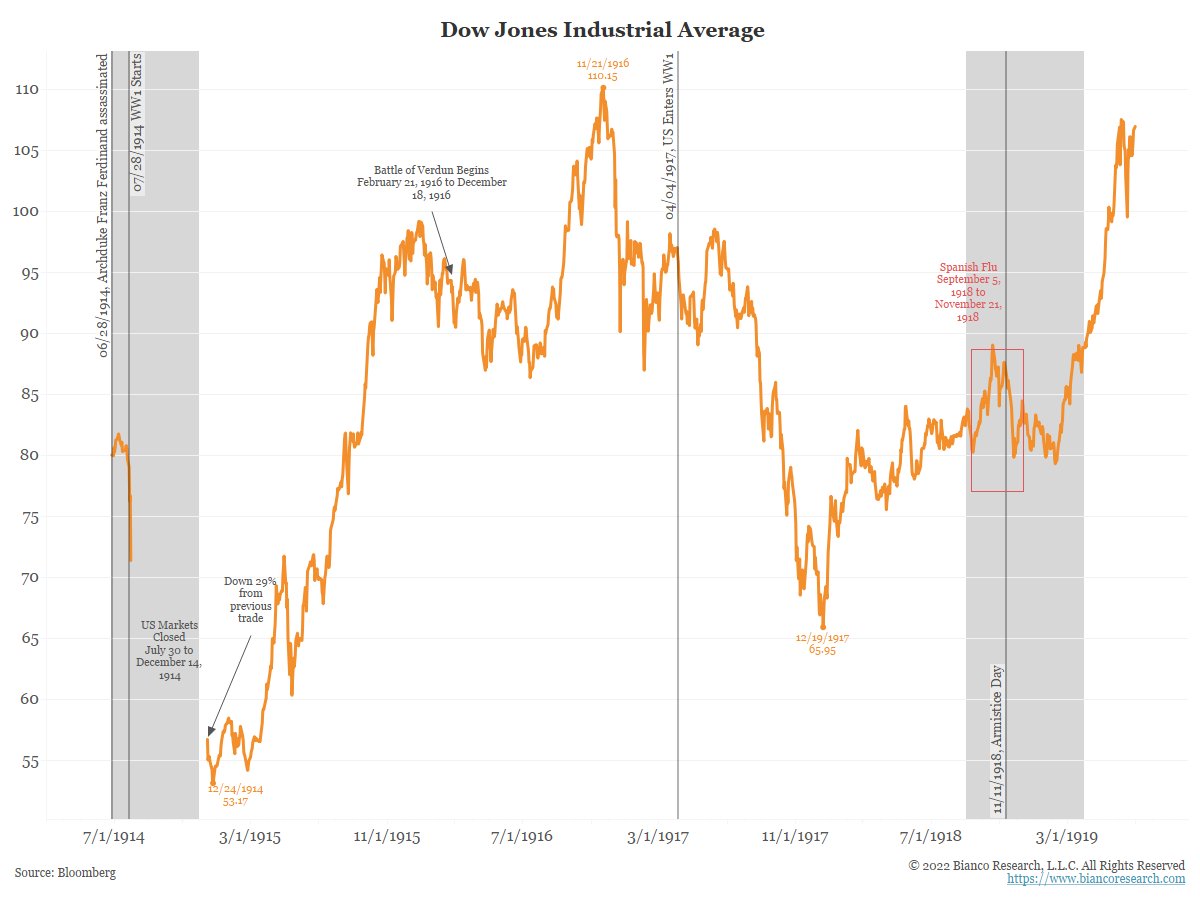
Turning to WW1, the data is a bit sparse.
The war started Jul 28, 1914. The US financial markets closed from Jul 30 to Dec 14, 1914. When they opened, the DJIA was 29% lower.
During this period the recessions (shaded) were the market closure and the Spanish Flu (red box).
Turning to WW1, the data is a bit sparse.
The war started Jul 28, 1914. The US financial markets closed from Jul 30 to Dec 14, 1914. When they opened, the DJIA was 29% lower.
During this period the recessions (shaded) were the market closure and the Spanish Flu (red box).
6/8
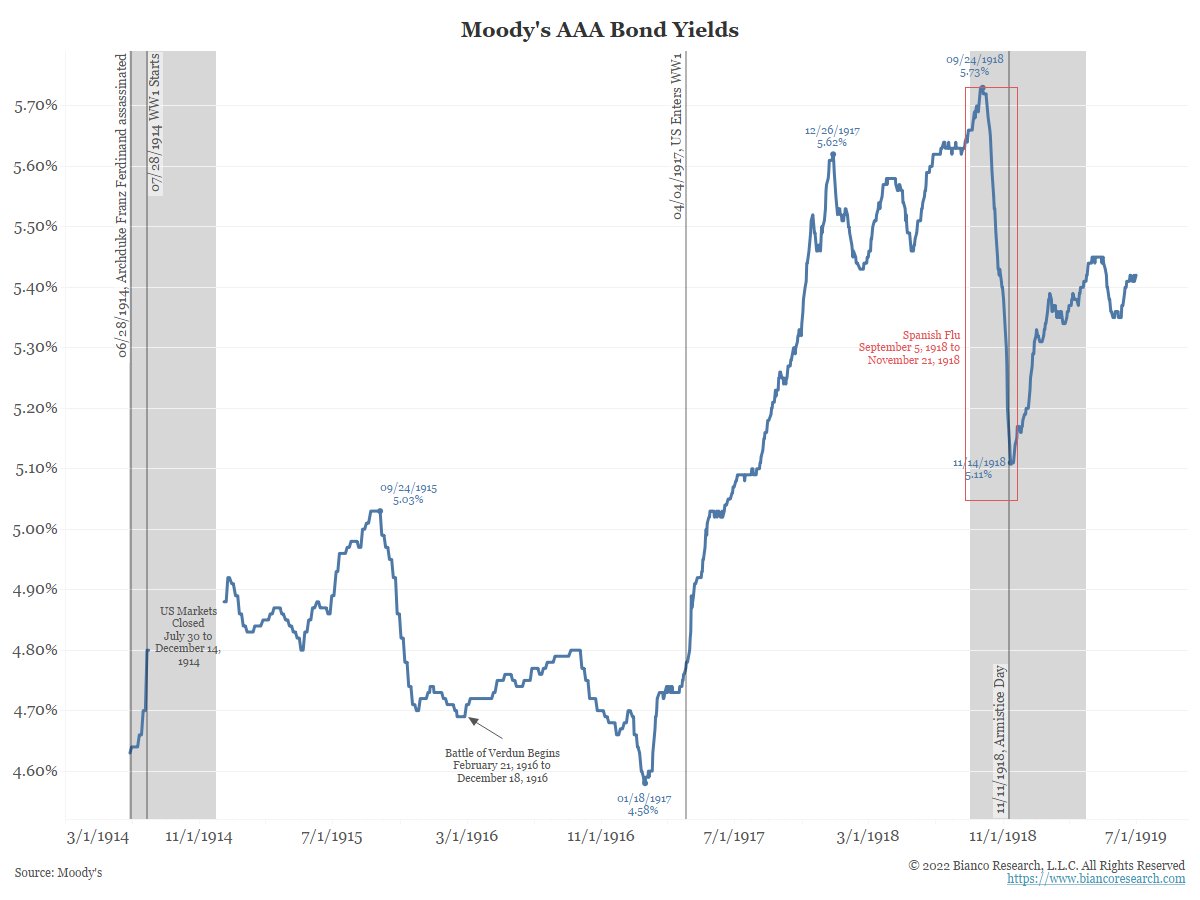
Also have interest rates for that period. They boomed.
Also have interest rates for that period. They boomed.
7/8
Prices boom during WW1. They more than doubled. And like WW2, stocks could not beat CPI.
So, while stocks did advance during WW1 and WW2, you were worse off as inflation and prices advanced more.
Prices boom during WW1. They more than doubled. And like WW2, stocks could not beat CPI.
So, while stocks did advance during WW1 and WW2, you were worse off as inflation and prices advanced more.

8/8
Conclusion
The rally in stocks last week looks like the Sept 1939. Let's see how long the overlay holds, because if it does, it will get really ugly.
During both WW1 and WW2 stocks could not beat CPI, similar to now, the SPX has lagged CPI for a year now.
Conclusion
The rally in stocks last week looks like the Sept 1939. Let's see how long the overlay holds, because if it does, it will get really ugly.
During both WW1 and WW2 stocks could not beat CPI, similar to now, the SPX has lagged CPI for a year now.
• • •
Missing some Tweet in this thread? You can try to
force a refresh