NASA Earth Profile picture
Mar 22, 2022 5 tweets 3 min read Read on X
Earth, the water planet. Its lakes, rivers, and oceans hold a crucial element for life. Earth-orbiting satellites help us track and better understand how this water moves around the globe. #WorldWaterDay
Groundwater – hidden from plain sight – is a vital source of water that can be difficult to track. The GRACE-FO mission detects subtle changes in Earth’s gravity caused by the movement of water, like from groundwater and polar ice. go.nasa.gov/37SVSi3 Artist rendition of the two...
Our favorite fruits, veggies, and grains depend on water. @NASA missions like SMAP and ECOSTRESS monitor soil moisture and drought, giving farmers a more complete picture and informing agricultural decisions. go.nasa.gov/3Nboljd Tractor over a soybean field
Climate change is making droughts more frequent and severe. Water managers across the U.S. turn to several @NASA tools that help tackle drought and manage increasingly limited water supplies. go.nasa.gov/3uiqDVd Image
If you need a little something else to snack on, build a tasty cheese board with the help of one critical element – water. NASA data included.

• • •

Missing some Tweet in this thread? You can try to force a refresh
 

Keep Current with NASA Earth

NASA Earth Profile picture

Stay in touch and get notified when new unrolls are available from this author!

Read all threads

This Thread may be Removed Anytime!

PDF

Twitter may remove this content at anytime! Save it as PDF for later use!

Try unrolling a thread yourself!

how to unroll video
  1. Follow @ThreadReaderApp to mention us!

  2. From a Twitter thread mention us with a keyword "unroll"
@threadreaderapp unroll

Practice here first or read more on our help page!

More from @NASAEarth

Aug 14, 2023
NASA confirms: this July was the hottest month on record.🌡️

Our record starts in 1880, when consistent global recordkeeping became possible. It shows an undeniable pattern of increasing global temperatures, primarily from human emissions of carbon dioxide. https://t.co/YqTfn9BMuXgo.nasa.gov/3qwsszU
Line graph of July temperatures in NASA’s temperature record. The bottom axis starts in 1880 (left) and goes to 2023 (right). On the X axis are temperature anomalies in degrees Celsius, from negative 0.5 to 1.0. A red line starts at zero and zig-zags up and down from year to year, but the overall trend steadily increases. By the end of the visualization, the red line spikes up over a 1.1 degree Celsius anomaly for July of 2023.
“This July was massively warmer than any previous July and any previous month on record, which goes back to 1880,” said @NASAGISS Director Gavin Schmidt.
Our planet is already feeling the effects of record-breaking temperatures and climate change.

2023 brought sweltering heat waves, record high Atlantic sea surface temperatures, and fires in Canada sending smoke thousands of miles away.
Read 5 tweets
Jan 12, 2023
2022 was effectively tied for the 5th warmest year on record, according to @NASA analysis. 🌏🌡

@NOAA’s record indicates 2022 is the 6th warmest. The past 9 years are the warmest years since at least 1880. go.nasa.gov/3VZBM9a
Earth in 2022 was about 1.9F (or about 1.1C) warmer than the late 19th century average.

This visualization shows how Earth has warmed since 1880. Red spirals indicate warmer than average temperatures.

Learn more: go.nasa.gov/3kcbPGc
See the data: go.nasa.gov/3ZqavzL
2022 was another La Niña year, a natural climate pattern of Pacific Ocean temperatures that tends to have a cooling effect.

Read 7 tweets
Jan 9, 2023
Breathe deeply... and thank phytoplankton. Why? NASA researchers study these tiny creatures to better understand our changing planet. A thread (🧵):
Phytoplankton are microscopic organisms that live in watery environments, both salty and fresh.
Phytoplankton are responsible for most of the transfer of carbon dioxide from the atmosphere to the ocean. Small changes in the growth of phytoplankton may affect atmospheric carbon dioxide concentrations, which would feed back to global surface temperatures.
Read 5 tweets
Jun 2, 2022
Each year, strong winds carry more than a billion metric tons of mineral dust from Earth’s deserts and other dry regions through the atmosphere.

How does that dust affect the environment and climate? EMIT is launching soon to help us find out! Here are 5 things to know 👇 Officials from NASA and JPL...
1. It will identify the composition of mineral dust from Earth’s arid regions.

From its perch on the @Space_Station, EMIT will map the world’s mineral dust source regions, providing information on the color and composition of dust sources globally for the first time.
2. It will clarify whether mineral dust heats or cools the planet.

Right now, scientists don’t know whether mineral dust has a net heating or cooling effect on the planet. Dust color matters because it determines whether the dust will absorb the Sun’s energy or reflect it.
Read 7 tweets
Mar 8, 2022
Women have been working to study and understand our home planet from @NASA's very beginning. On #InternationalWomensDay2022 and all #WomensHistoryMonth, we’ll celebrate some of the women who help us see Earth more clearly. Group photo of the Ladies o...
Dr. Kate Calvin is @NASA’s Chief Scientist and Senior Climate Advisor. She connects climate science across the agency so we can better understand how our planet is changing. #IWD2022 #InternationalWomensDay

go.nasa.gov/3pMWCeu Dr. Kate Calvin headshot
Sascha Burton helped lead mechanical integration and test operations for the upcoming SWOT mission that will take @NASA’s first global survey of Earth’s surface water. She is now ramping up to support the NISAR mission with radar antenna deployment test campaigns. #IWD2022 Sascha Burton headshot
Read 8 tweets
Jan 24, 2022
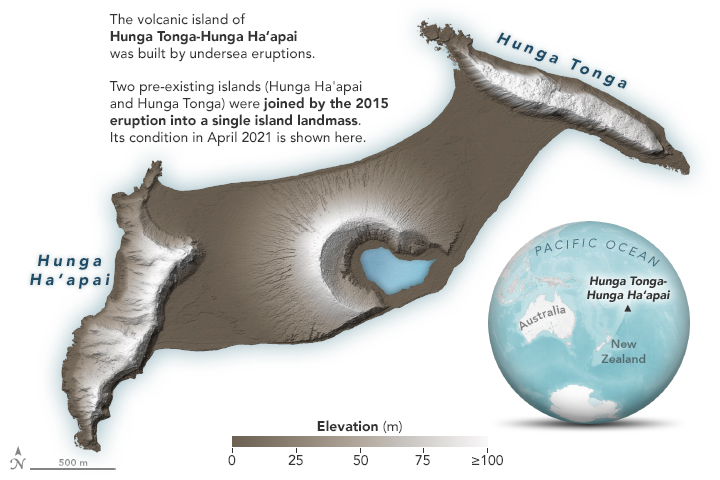
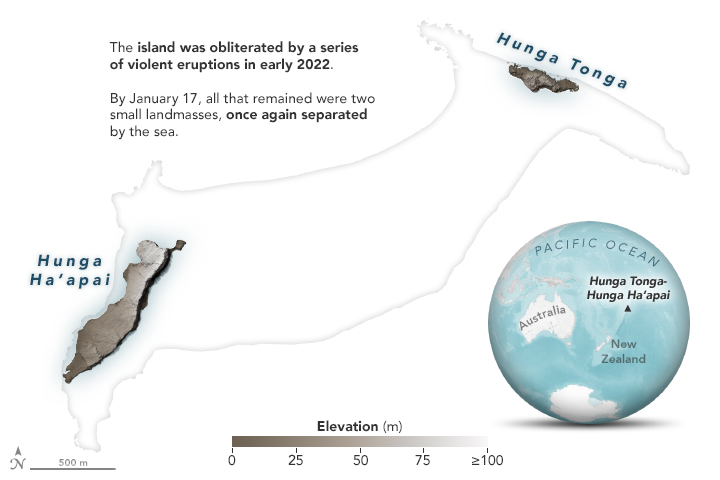
A mapping effort led by @NASAGoddard's chief scientist shows how the explosive volcanic eruption at #Tonga's #HungaTongaHungaHaapai obliterated the island. go.nasa.gov/3rE8jo4
“This is a preliminary estimate, but we think the amount of energy released by the eruption was equivalent to somewhere between 4 to 18 megatons of TNT,” said Jim Garvin. 🌋
For comparison, scientists estimate Mount St. Helens exploded in 1980 with 24 megatons and Krakatoa burst in 1883 with 200 megatons of energy. go.nasa.gov/3tRKk7t
Read 7 tweets

Did Thread Reader help you today?

Support us! We are indie developers!


This site is made by just two indie developers on a laptop doing marketing, support and development! Read more about the story.

Become a Premium Member ($3/month or $30/year) and get exclusive features!

Become Premium

Don't want to be a Premium member but still want to support us?

Make a small donation by buying us coffee ($5) or help with server cost ($10)

Donate via Paypal

Or Donate anonymously using crypto!

Ethereum

0xfe58350B80634f60Fa6Dc149a72b4DFbc17D341E copy

Bitcoin

3ATGMxNzCUFzxpMCHL5sWSt4DVtS8UqXpi copy

Thank you for your support!

Follow Us!

:(