Dealing with imbalanced datasets 🐁 ⚖️ 🐘
Real world datasets are often imbalanced - some of the classes appear much more often than others.
The problem? You ML model will likely learn to only predict the dominant classes.
What can you do about it? 🤔
Thread 🧵 #RepostFriday
Real world datasets are often imbalanced - some of the classes appear much more often than others.
The problem? You ML model will likely learn to only predict the dominant classes.
What can you do about it? 🤔
Thread 🧵 #RepostFriday
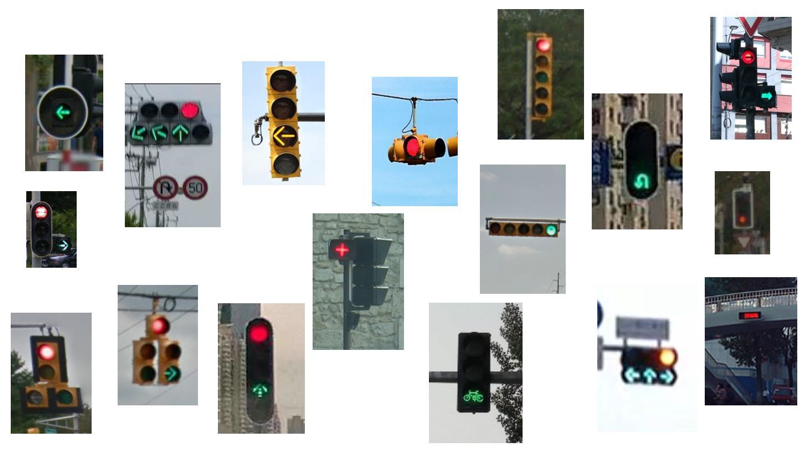
Example 🚦
We will be dealing with an ML model to detect traffic lights for a self-driving car 🤖🚗
Traffic lights are small so you will have much more parts of the image that are not traffic lights.
Furthermore, yellow lights 🟡 are much rarer than green 🟢 or red 🔴.
We will be dealing with an ML model to detect traffic lights for a self-driving car 🤖🚗
Traffic lights are small so you will have much more parts of the image that are not traffic lights.
Furthermore, yellow lights 🟡 are much rarer than green 🟢 or red 🔴.
The problem ⚡
Imagine we train a model to classify the color of the traffic light. A typical distribution will be:
🔴 - 56%
🟡 - 3%
🟢 - 41%
So, your model can get to 97% accuracy just by learning to distinguish red from green.
How can we deal with this?
Imagine we train a model to classify the color of the traffic light. A typical distribution will be:
🔴 - 56%
🟡 - 3%
🟢 - 41%
So, your model can get to 97% accuracy just by learning to distinguish red from green.
How can we deal with this?
Evaluation measures 📐
First, you need to start using a different evaluation measure than accuracy:
- Precision per class
- Recall per class
- F1 score per class
I also like to look at the confusion matrix to get an overview. Always look at examples from the data as well!
First, you need to start using a different evaluation measure than accuracy:
- Precision per class
- Recall per class
- F1 score per class
I also like to look at the confusion matrix to get an overview. Always look at examples from the data as well!
In the traffic lights example above, we will see very poor recall for 🟡 (most real examples were not recognized), while precision will likely be high.
At the same time, the precision of 🟢 and 🔴 will be lower (🟡 will be classified as 🟢 or 🔴).
At the same time, the precision of 🟢 and 🔴 will be lower (🟡 will be classified as 🟢 or 🔴).
Get more data 🔢
The best thing you can do is to collect more data of the underrepresented classes. This may be hard or even impossible...
You can imagine ways to record more yellow lights, but imagine you want to detect a very rare disease in CT images?
The best thing you can do is to collect more data of the underrepresented classes. This may be hard or even impossible...
You can imagine ways to record more yellow lights, but imagine you want to detect a very rare disease in CT images?
Balance your data 🔀
The idea is to resample your dataset so it is better balanced.
▪️Undersampling - throw away some examples of the dominant classes
▪️ Oversampling - get more samples of the underrepresented class
The idea is to resample your dataset so it is better balanced.
▪️Undersampling - throw away some examples of the dominant classes
▪️ Oversampling - get more samples of the underrepresented class
Undersampling ⏬
The easiest way is to just randomly throw away samples from the dominant class.
Even better, you can use some unsupervised clustering method and throw out only samples from the big clusters.
The problem of course is that you are throwing out valuable data...
The easiest way is to just randomly throw away samples from the dominant class.
Even better, you can use some unsupervised clustering method and throw out only samples from the big clusters.
The problem of course is that you are throwing out valuable data...
Oversampling ⏫
This is more difficult. You can just repeat sample, but it won't work very good.
You can use methods like SMOTE (Synthetic Minority Oversampling Technique) to generate new samples interpolating between existing ones. This may not be easy for complex images.
This is more difficult. You can just repeat sample, but it won't work very good.
You can use methods like SMOTE (Synthetic Minority Oversampling Technique) to generate new samples interpolating between existing ones. This may not be easy for complex images.
Oversampling ⏫
If you are dealing with images, you can use data augmentation techniques to create new samples by modifying the existing ones (rotation, flipping, skewing, color filters...)
You can also use GANs or simulation the synthesize completely new images.
If you are dealing with images, you can use data augmentation techniques to create new samples by modifying the existing ones (rotation, flipping, skewing, color filters...)
You can also use GANs or simulation the synthesize completely new images.
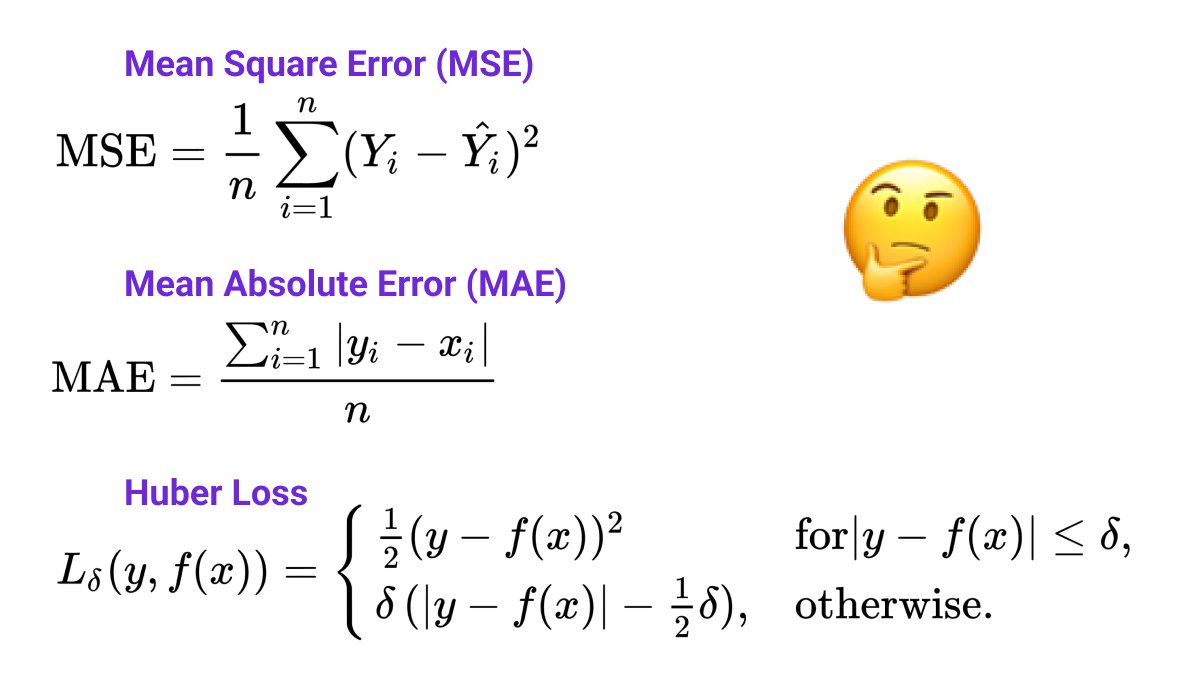
Adapting your loss 📉
Another strategy is to modify your loss function to penalize misclassification of the underrepresented classes more than the dominant ones.
In the 🚦 example we can set them like this (proportionally to the distribution)
🔴 - 1.8
🟡 - 33.3
🟢 - 2.4
Another strategy is to modify your loss function to penalize misclassification of the underrepresented classes more than the dominant ones.
In the 🚦 example we can set them like this (proportionally to the distribution)
🔴 - 1.8
🟡 - 33.3
🟢 - 2.4
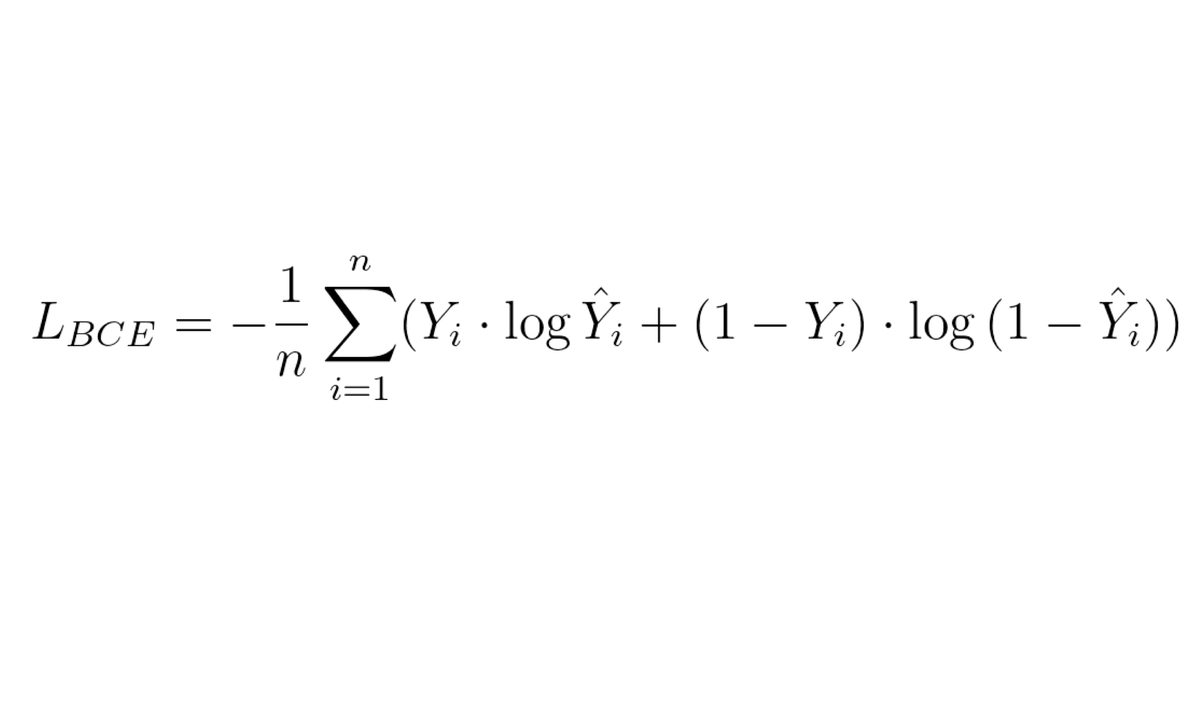
If you are training a neural network with TensorFlow or PyTorch you can do this very easily:
▪️ TensorFlow - use the class_weights parameter in the fit() function (tensorflow.org/versions/r2.0/…)
▪️PyTorch - use the weight parameter in the CrossEntropyLoss (pytorch.org/docs/stable/ge…)
▪️ TensorFlow - use the class_weights parameter in the fit() function (tensorflow.org/versions/r2.0/…)
▪️PyTorch - use the weight parameter in the CrossEntropyLoss (pytorch.org/docs/stable/ge…)
Summary 🏁
In practice, you will likely need to combine all of the strategies above to achieve good performance.
Look at different evaluation metrics and start playing with the parameters to find a good balance (pun intended)
In practice, you will likely need to combine all of the strategies above to achieve good performance.
Look at different evaluation metrics and start playing with the parameters to find a good balance (pun intended)
Every Friday I repost one of my old threads so more people get the chance to see them. During the rest of the week, I post new content on machine learning and web3.
If you are interested in seeing more, follow me @haltakov
If you are interested in seeing more, follow me @haltakov
• • •
Missing some Tweet in this thread? You can try to
force a refresh