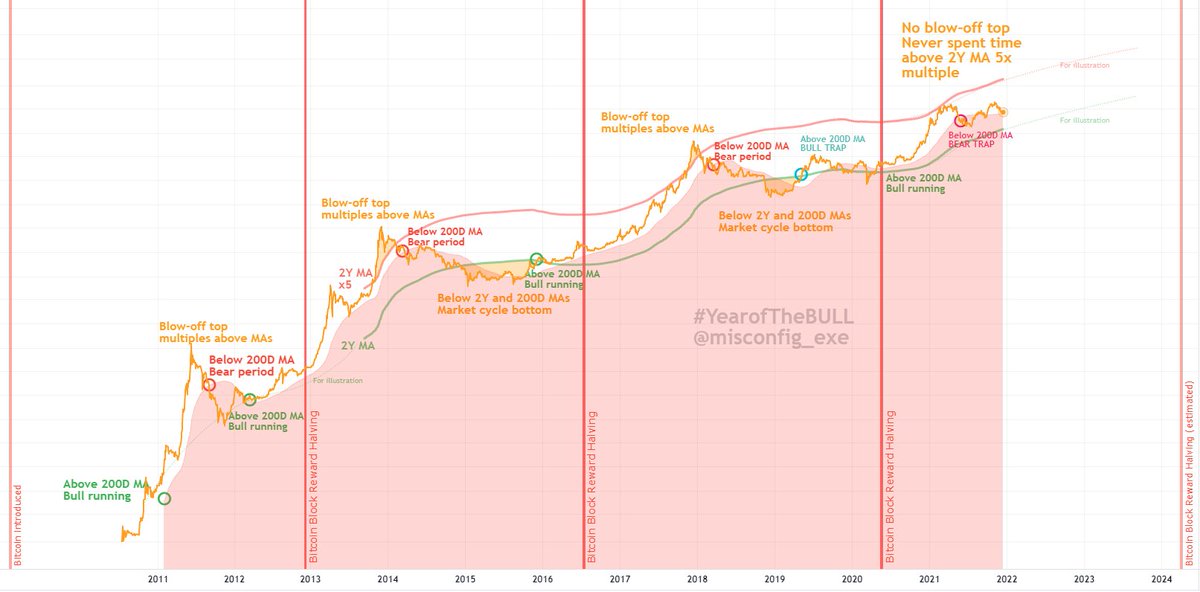
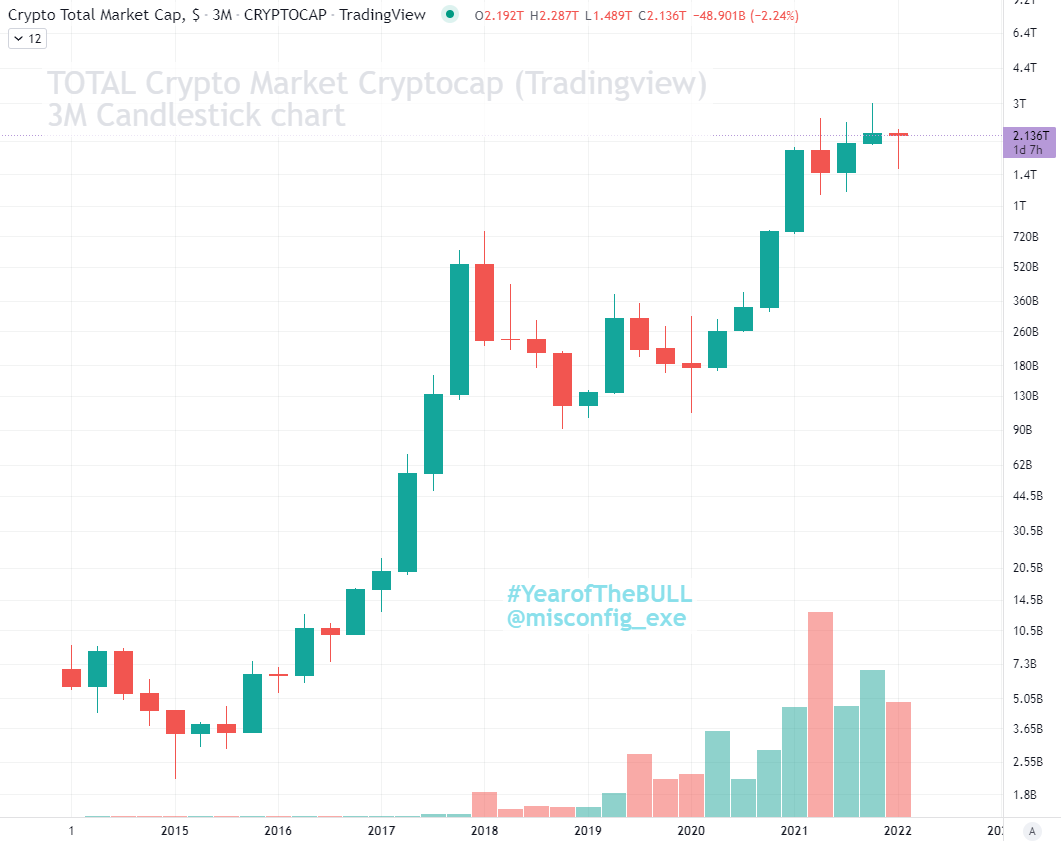
#Bitcoin and TOTAL #crypto market 1Q charts -- each candlestick is 3 Months
What does this tell us about the market? Let's dive in - following tweets.
1/9
What does this tell us about the market? Let's dive in - following tweets.
1/9

The current 3M candle (1 day until close) is in the form of a BULLish "Long Lower Shadow".
Long shadows (wicks) especially without a wick on the opposite end (I'll touch on that) often mean trend reversal.
2/9
Long shadows (wicks) especially without a wick on the opposite end (I'll touch on that) often mean trend reversal.
2/9

Taking a look at the prior candle, it also formed a long-shadow, but in the opposite direction. While the close was higher than the open, it still formed a BEARish Long Upper Shadow.
3/9
3/9

Considering that the price rose +57% during this candle then fell nearly -29% in the following candle, I'd say this reversal pattern played out.
4/9
4/9

Context: This is occurring within a 1.25Y-long rising consolidation channel with higher highs and higher lows, during a time of rising volume on the 3M chart too.
5/9
5/9

Another way to look at the current candlestick is that it is nearly a Dragonfly Doji, which is "T"-shaped.
A +1.37% rise to tomorrow's close would put this as a firm Dragonfly.
A dragonfly doji that appears after a downtrend is bullish, like a hammer candle.
6/9
A +1.37% rise to tomorrow's close would put this as a firm Dragonfly.
A dragonfly doji that appears after a downtrend is bullish, like a hammer candle.
6/9

Meanwhile, the TOTAL market cap chart is also putting in a Long Lower Shadow candle after a Long Upper Shadow inside of a rising consolidation channel; though volume is down compared to prior quarter here.
7/9
7/9

Hard to make a firm conclusion. This type of pattern (especially back-to-back reversal Long-Shadow candles) hasn't occurred before on BTC or TOTAL.
But ...
8/9
But ...
8/9
Overall I think these are long-term bullish signals, and while anything is possible, I expect new highs on #Bitcoin over the course of the next quarters.
9/9 Fin.
9/9 Fin.

¿Necesita traducción al #español de este #Bitcoin análisis?
Gracias a @tucriptotime por traducir.
Gracias a @tucriptotime por traducir.
https://twitter.com/misconfig_exe/status/1509243059237576709/retweets/with_comments
@threadreaderapp unroll please :)
• • •
Missing some Tweet in this thread? You can try to
force a refresh