1/ In this thread we show how S&P500 indicators have accurately determined the set of #Bitcoin bottoms throughout its history.
There is no certainty in trading, but the odds that this right detection continuing is over 80%.
This work shows that the last #BTC bottom is recent.
There is no certainty in trading, but the odds that this right detection continuing is over 80%.
This work shows that the last #BTC bottom is recent.
2/ The Standard and Poor's 500 (S&P 500), $SPX, is a stock market index tracking the performance of 500 large companies listed on stock exchanges in the United States.
It is one of the most commonly followed equity indices.
Market cap : US$42.4 trillion.
It is one of the most commonly followed equity indices.
Market cap : US$42.4 trillion.
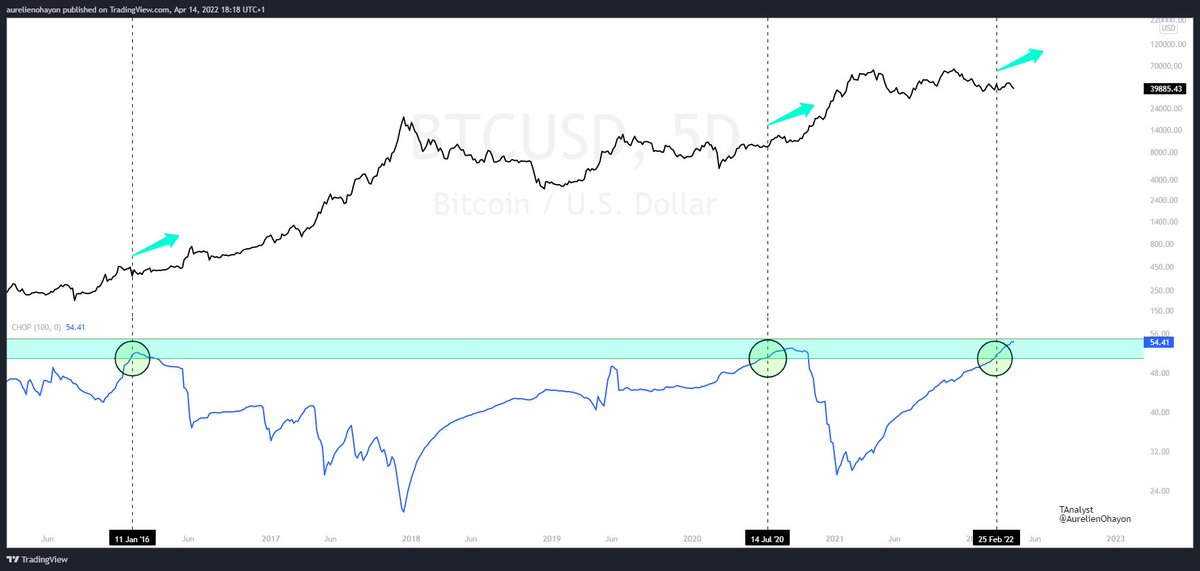
3/ BTC's bottoms detection using the 2W-Stochastic RSI K-line of the S&P500.
https://twitter.com/AurelienOhayon/status/1515033155220221952?s=20&t=RAoNQh_FVA9G9x4Qj7jNiA
4/ BTC's bottoms detection using the 2W-CMO (Chande Momentum Oscillator) of the S&P500.
https://twitter.com/AurelienOhayon/status/1515112280102518790?s=20&t=7VzD08ThXu1OMw0R-G6cDw
5/ BTC's bottoms detection using the 3D-PPO (Percentage Price Oscillator) of the S&P500.
https://twitter.com/AurelienOhayon/status/1515122437448421379?s=20&t=HCP47roRPhfhZZ2ys0w7dQ
6/ BTC's bottoms detection using the 2W-RSI of the S&P500.
https://twitter.com/AurelienOhayon/status/1514804515479818241?s=20&t=qp3-FaYFn43PMZcSZGoqUA
7/ BTC's bottoms detection using the lower of the Weekly Bollinger Bands (Length 30 StdDev 3) of the S&P500.
https://twitter.com/AurelienOhayon/status/1515444513875103754?s=20&t=SmygxAuPdghdoQGgAiuZRQ
8/ BTC's bottoms detection using the daily dead crossing (MA50 crosses MA200) of the S&P500.
https://twitter.com/AurelienOhayon/status/1515458855504855050?s=20&t=SmygxAuPdghdoQGgAiuZRQ
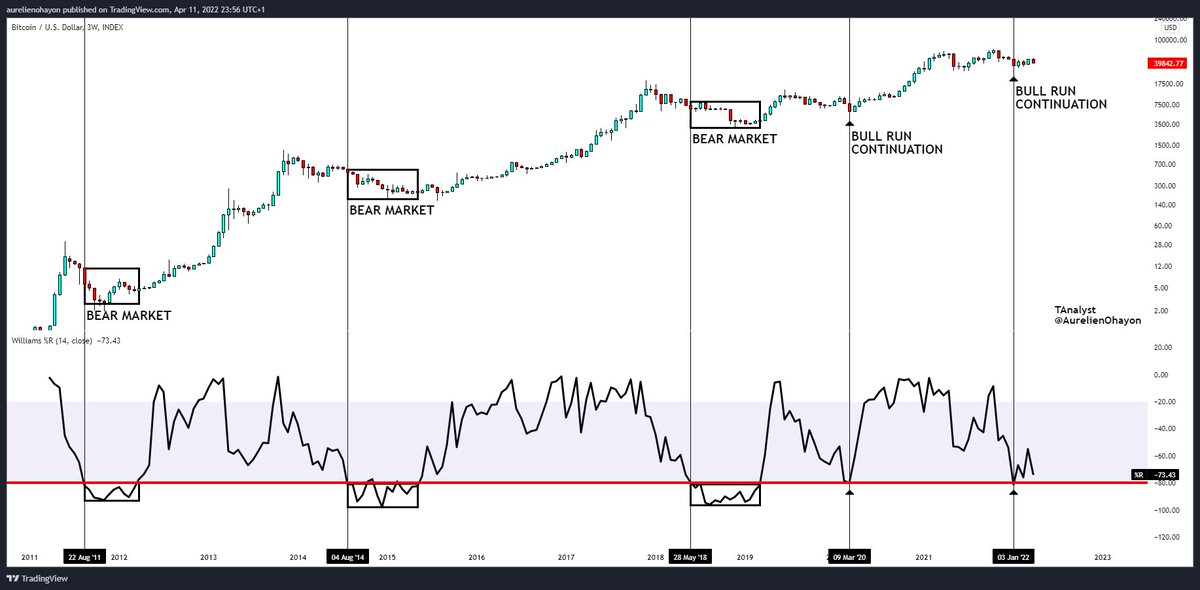
9/ BTC's bottoms detection using the 3W-Williams %R of the S&P500.
https://twitter.com/AurelienOhayon/status/1515473408662081537?s=20&t=etO3VRDnIcANlsmybTvMUw
10/ BTC's bottoms detection using Weekly Stochastic RSI K-line of the S&P500.
https://twitter.com/AurelienOhayon/status/1515708159410806787?s=20&t=JTlL04wbK7yxR3EOXiURAw
11/ BTC's bottoms detection using Weekly Aroon Indicator of the S&P500.
https://twitter.com/AurelienOhayon/status/1515749300285984784?s=20&t=GiQt_ApsPj6A3qHS4P_3nQ
12/ #BTC's bottoms detection using the 2W-Percentage Price Oscillator (PPO) of the #SPX.
https://twitter.com/AurelienOhayon/status/1515796768210010113?s=20&t=GiQt_ApsPj6A3qHS4P_3nQ
13/ #BTC's bottoms detection using the Weekly Chaikin Money Flow indicator (CMF) of #SPX.
https://twitter.com/AurelienOhayon/status/1515811254534909956?s=20&t=GiQt_ApsPj6A3qHS4P_3nQ
• • •
Missing some Tweet in this thread? You can try to
force a refresh