ℹ️ Big German Mortality Update! 🪦
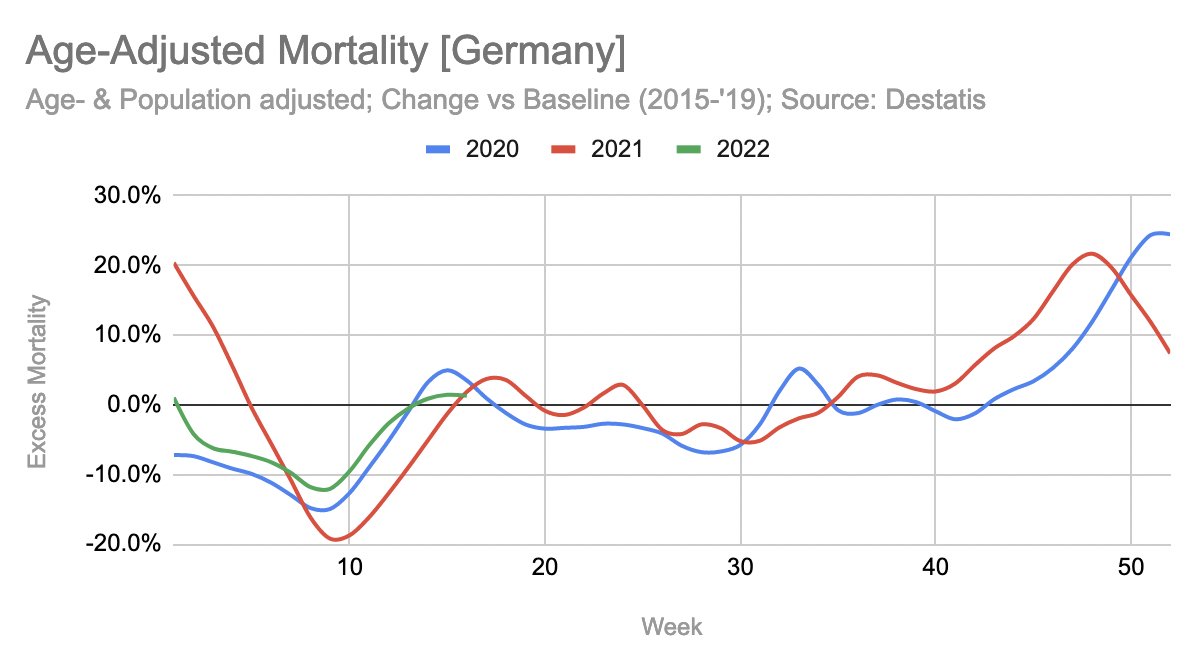
Currently in week 15/22 +0.8% age-adjusted all-cause excess mortality over baseline 2015-2019.
🧵 1/n
#Covid #Covid19 #Corona #Coronavirus
Currently in week 15/22 +0.8% age-adjusted all-cause excess mortality over baseline 2015-2019.
🧵 1/n
#Covid #Covid19 #Corona #Coronavirus
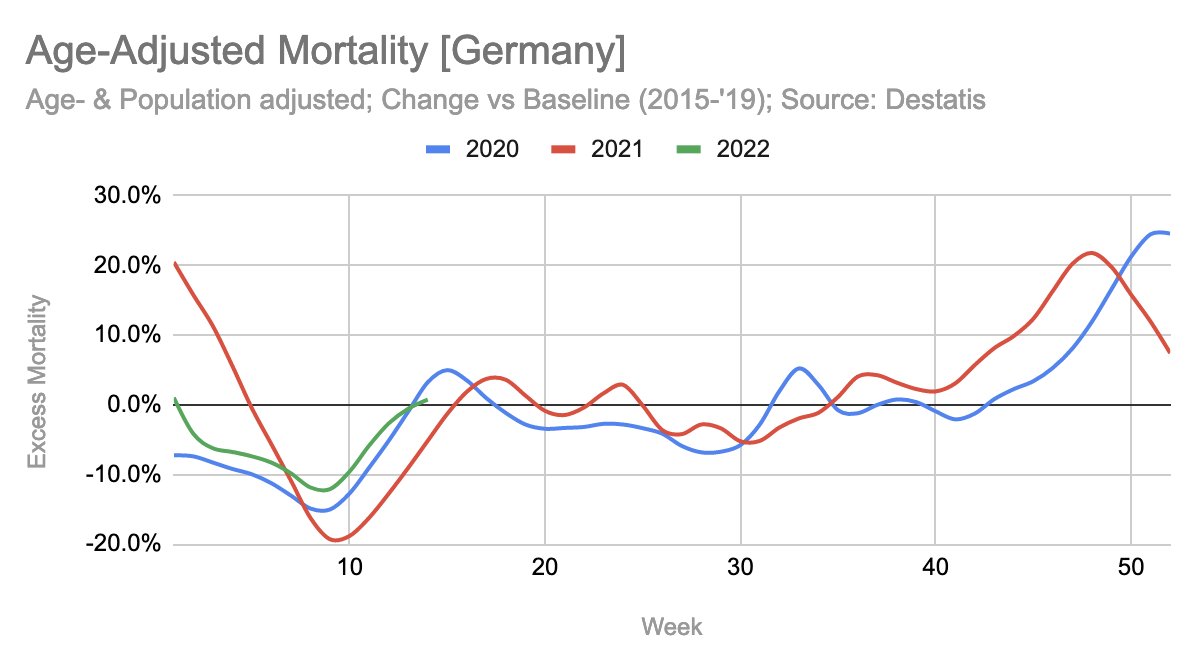
Summed up by year-to-date:

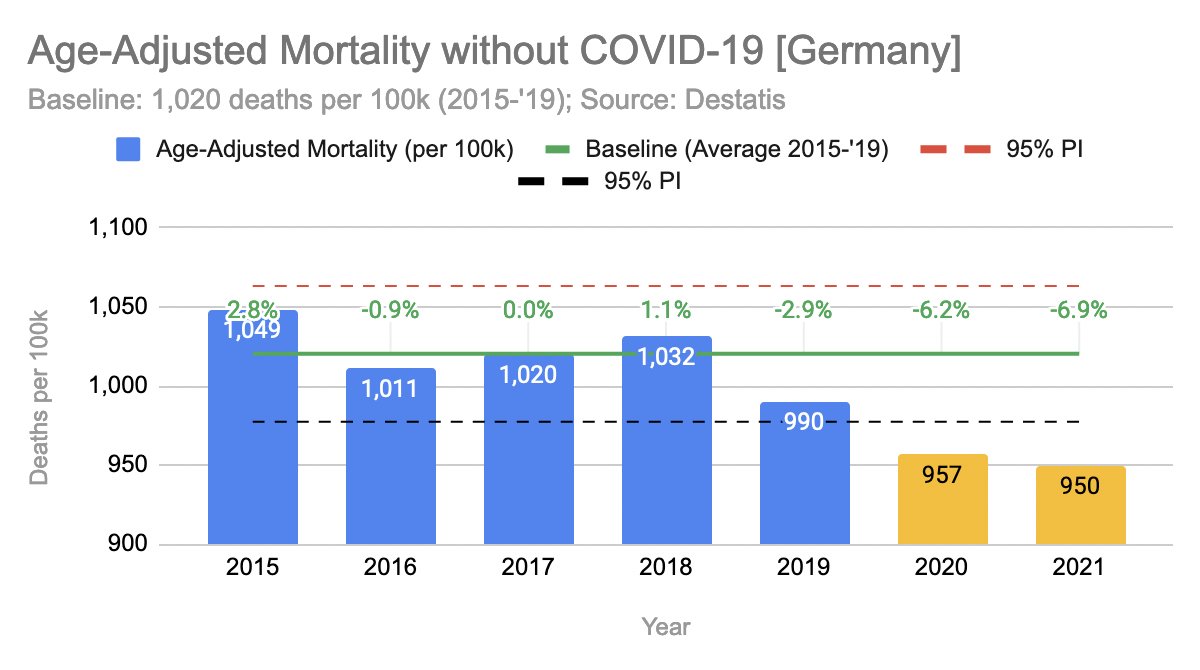
Full year:

Full year without COVID-19:
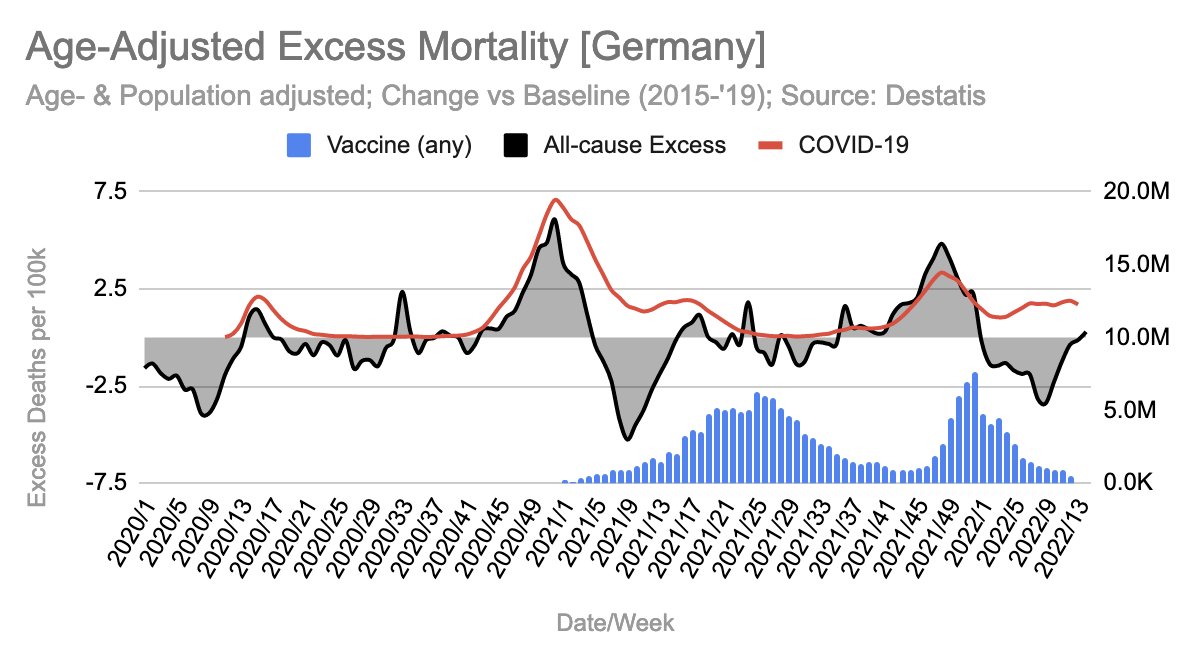
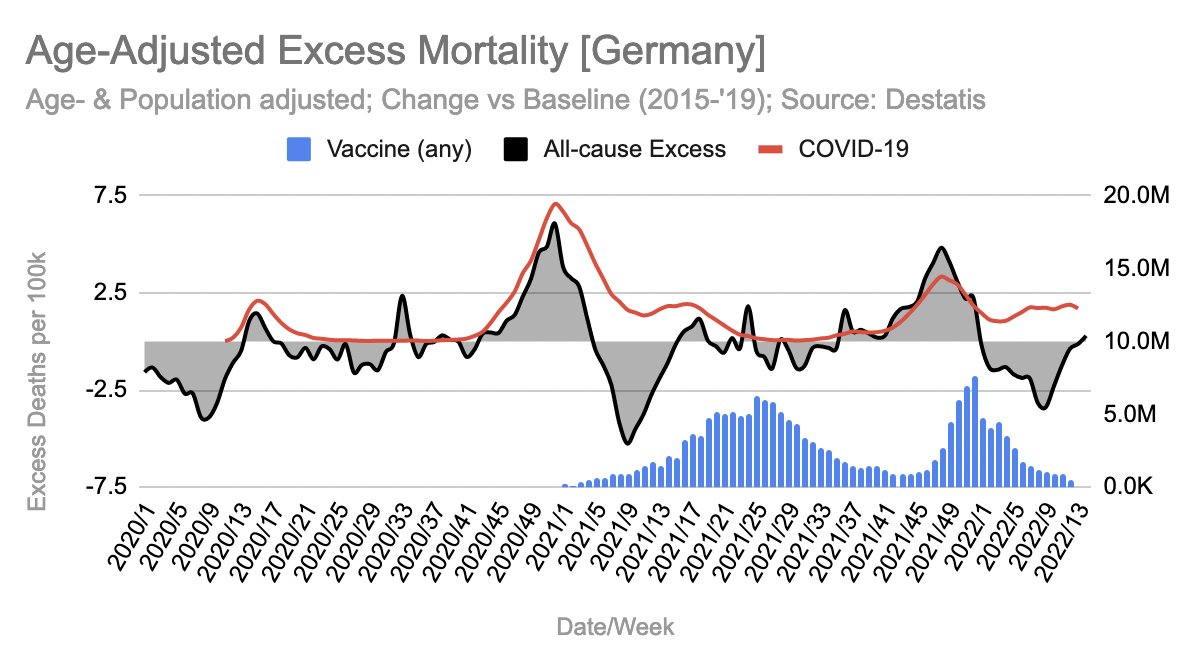
Over time vs vaccinations and COVID-19 deaths:
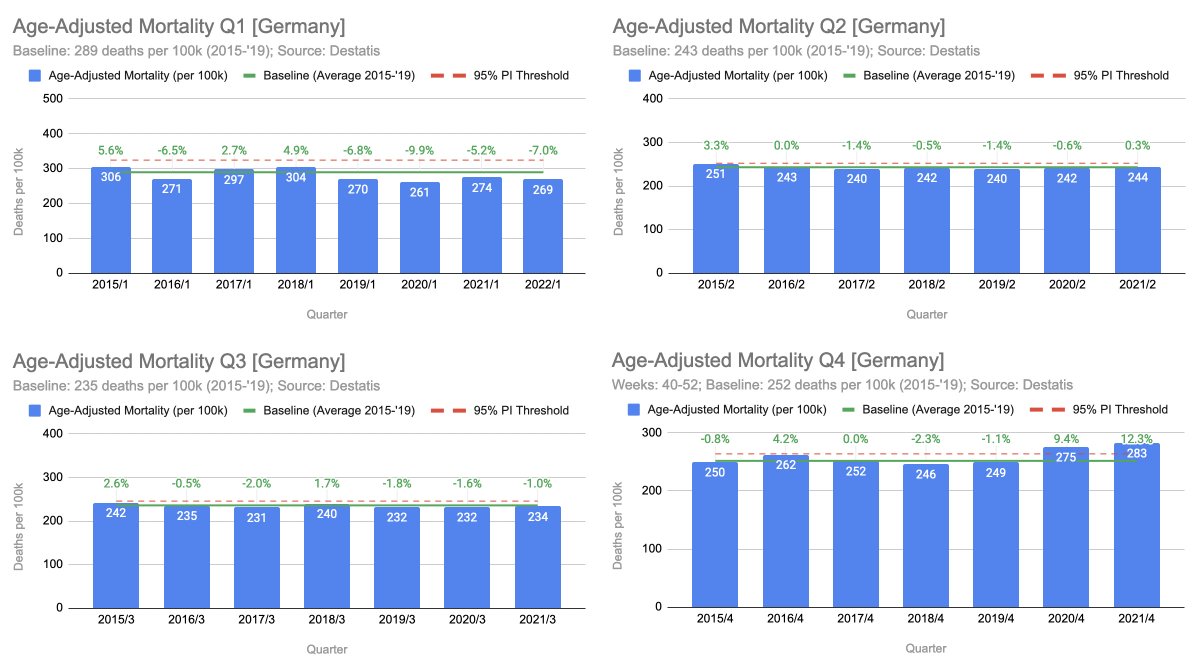
By quarter:
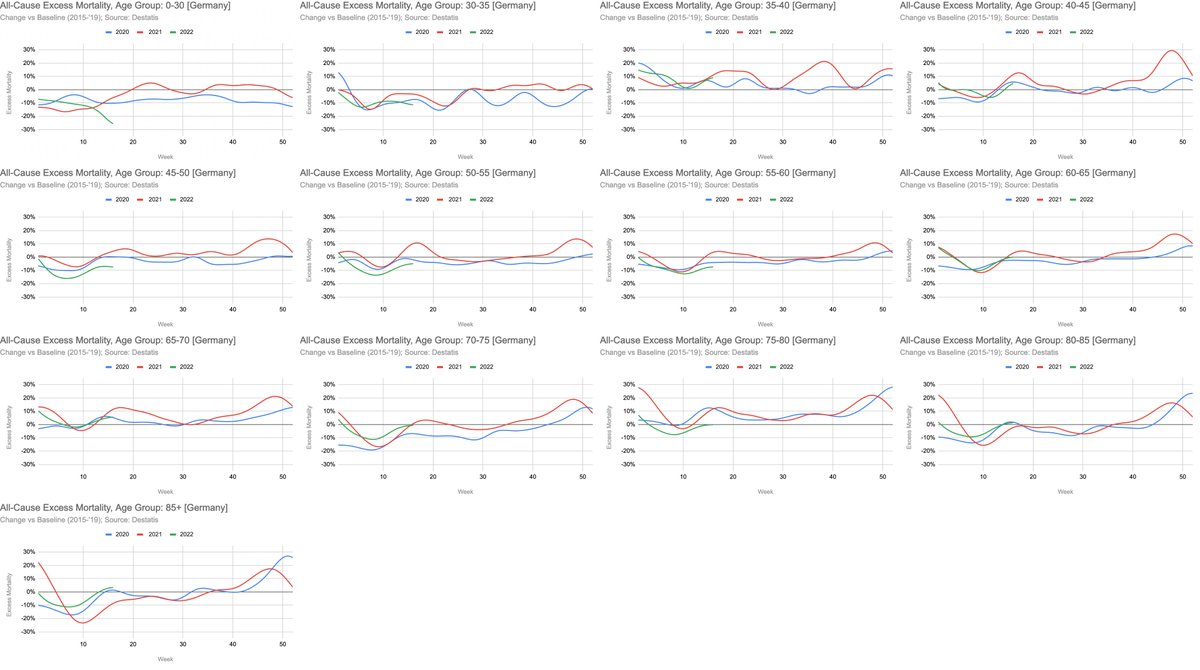
By age group:
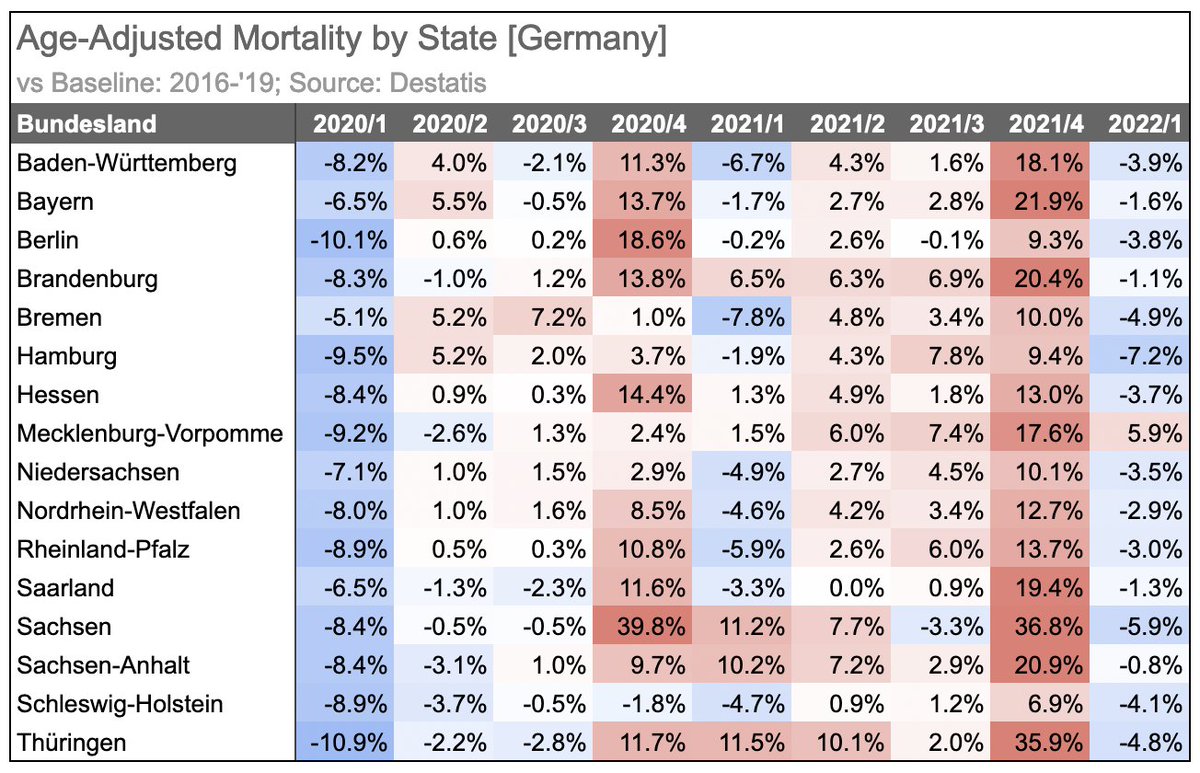
By state & quarter:
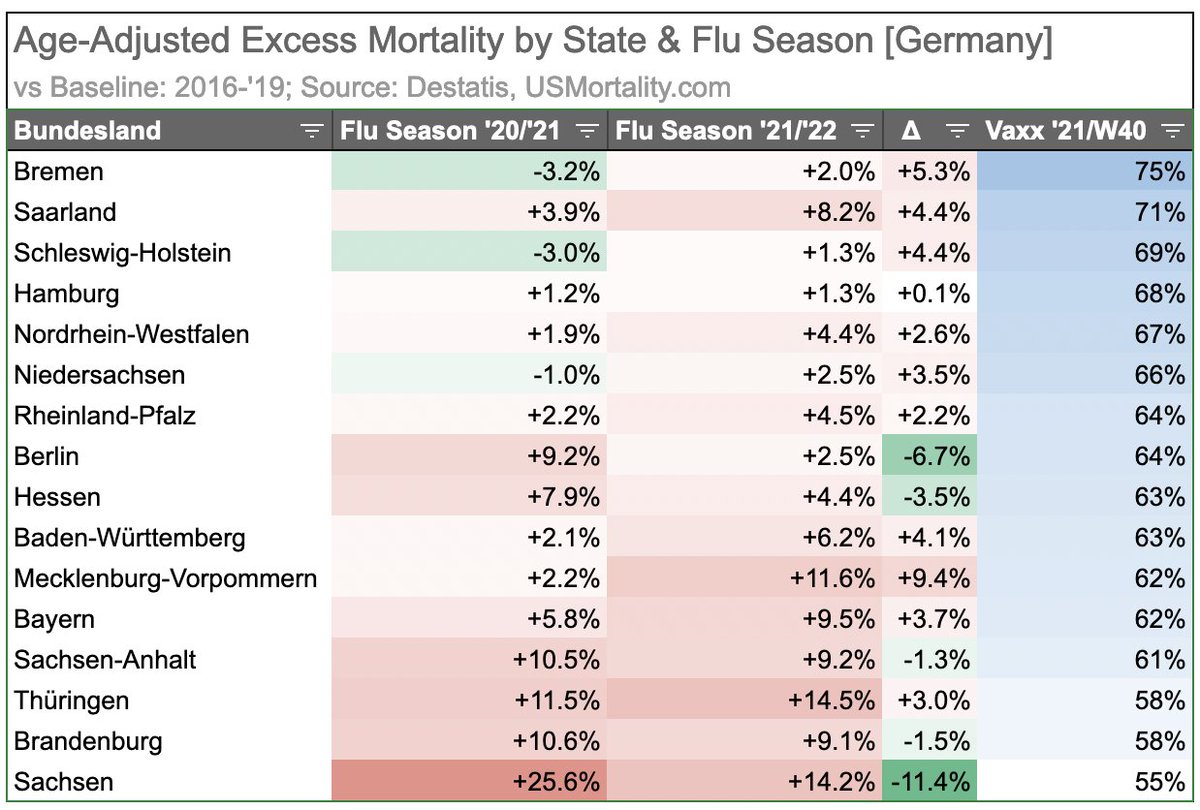
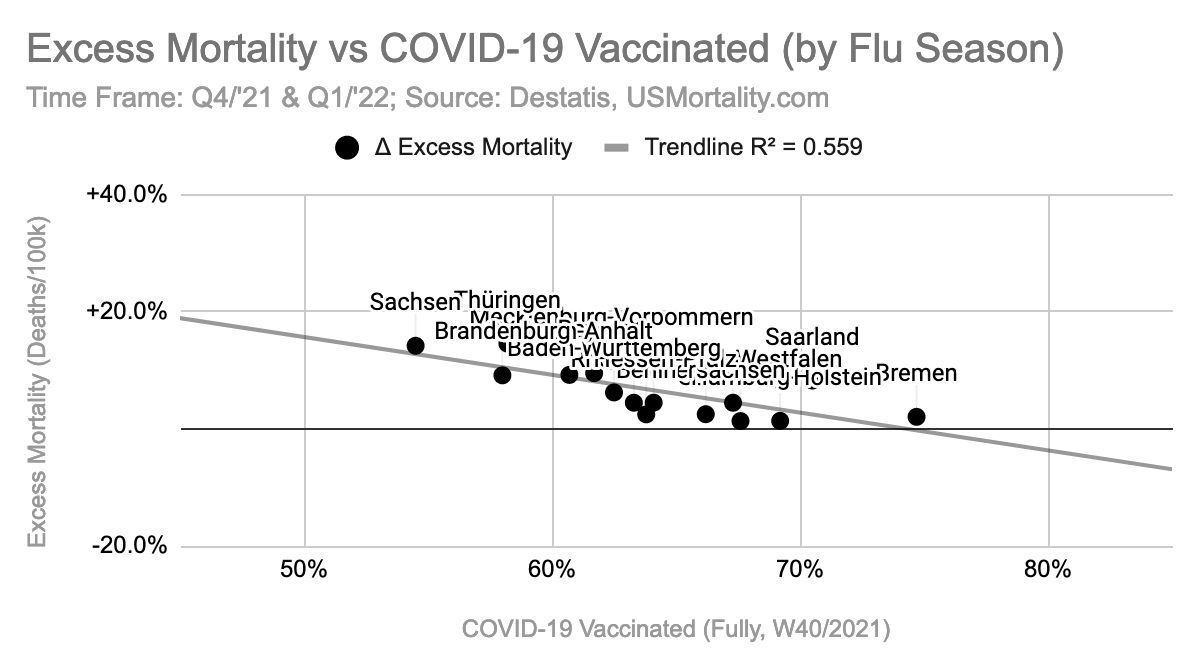
By state and flu season for the last 2 years:
Correlating the change (delta) in excess mortality of the last two flu seasons by state with its vaccination levels reveals that the vaccine did not seem to have any sign. effect. (The slight positive correlation, is not stat. significant).
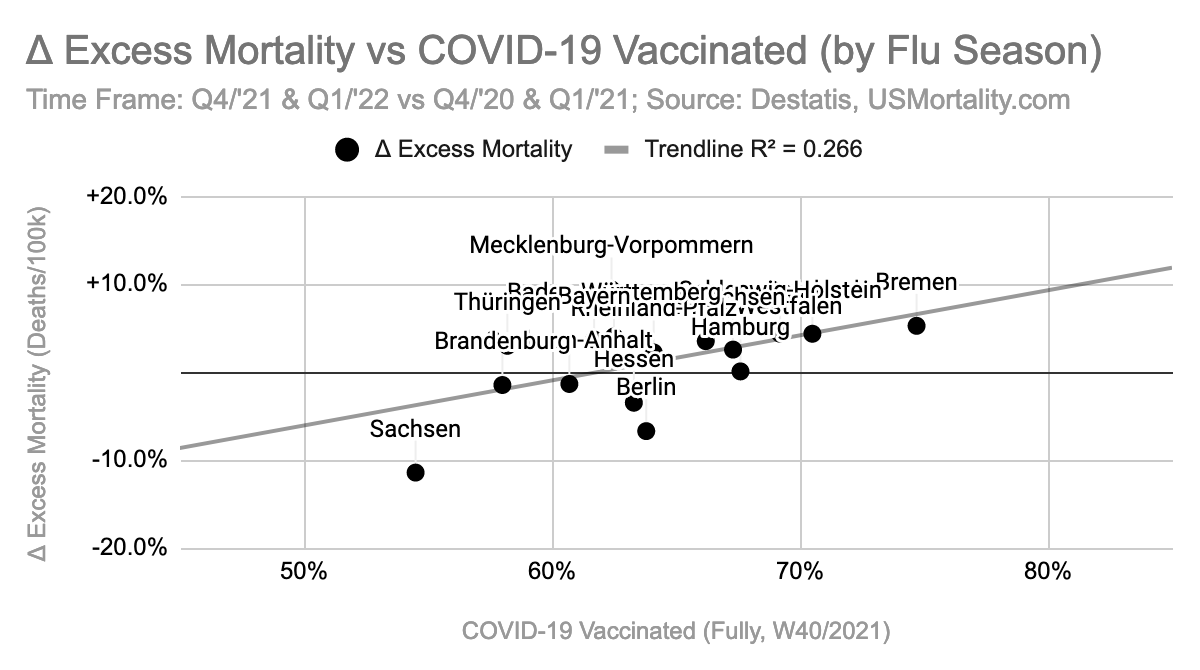
Now you might ask, why correlate the delta vs vaccination and not just the excess mortality?
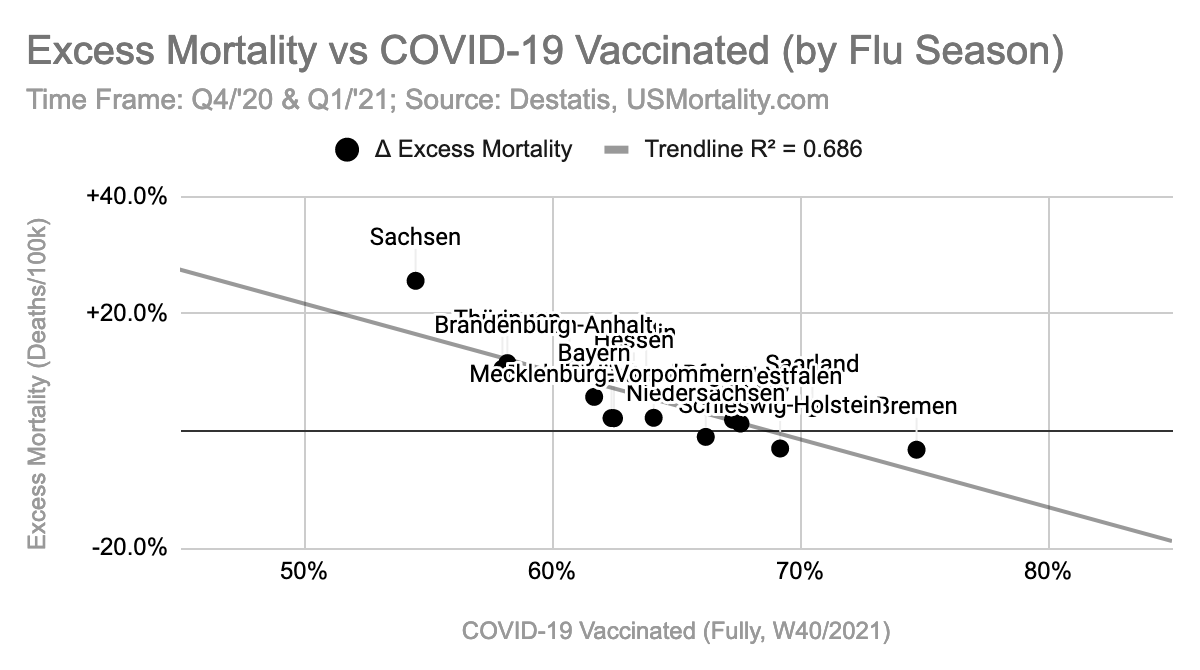
The reason is that we can already see a trend essentially without vaccination in the flu season '20/'21. (Vaccinations until the end of season <10%).
The reason is that we can already see a trend essentially without vaccination in the flu season '20/'21. (Vaccinations until the end of season <10%).

For example, in the '20/'21 flu season Bremen had a -3.2% mortality deficit, while in the '21/'22 season, the excess mortality went to +2.0%. An increase of +5.2%, that is with the introduction of vaccines and with so called "milder variants". Wouldn't we expect to see a decline?
Sources & Calculations:
> docs.google.com/spreadsheets/d…
> docs.google.com/spreadsheets/d…
> docs.google.com/spreadsheets/d…
> docs.google.com/spreadsheets/d…
> docs.google.com/spreadsheets/d…
> docs.google.com/spreadsheets/d…
Addendum: Covid-19 Update!
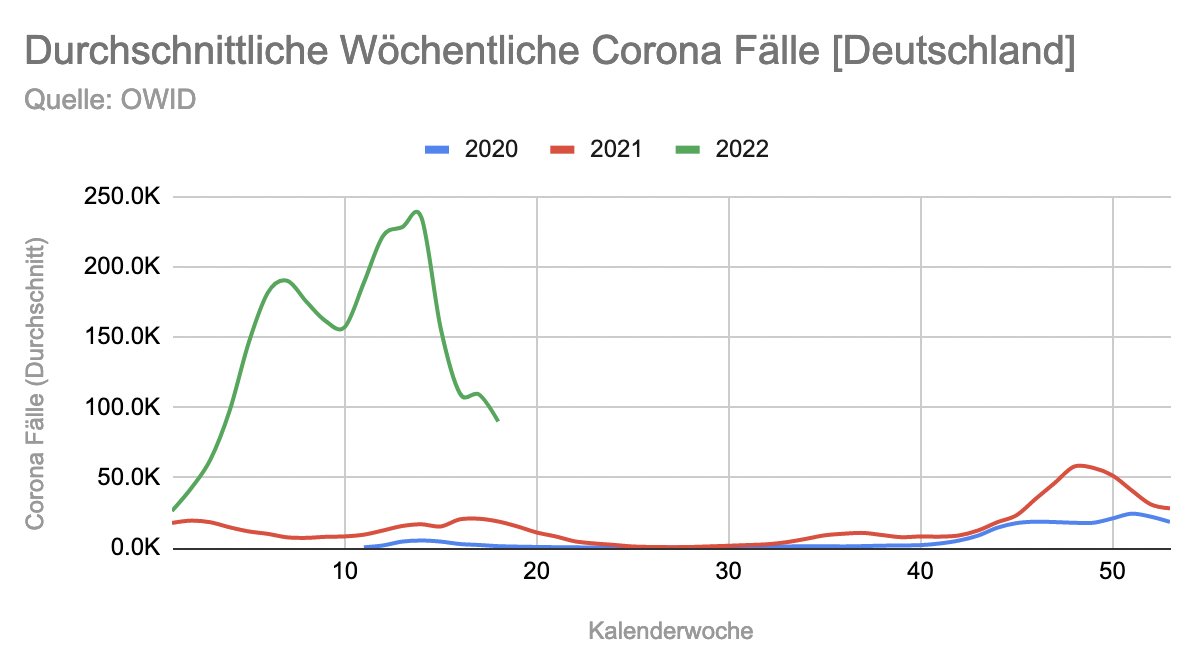
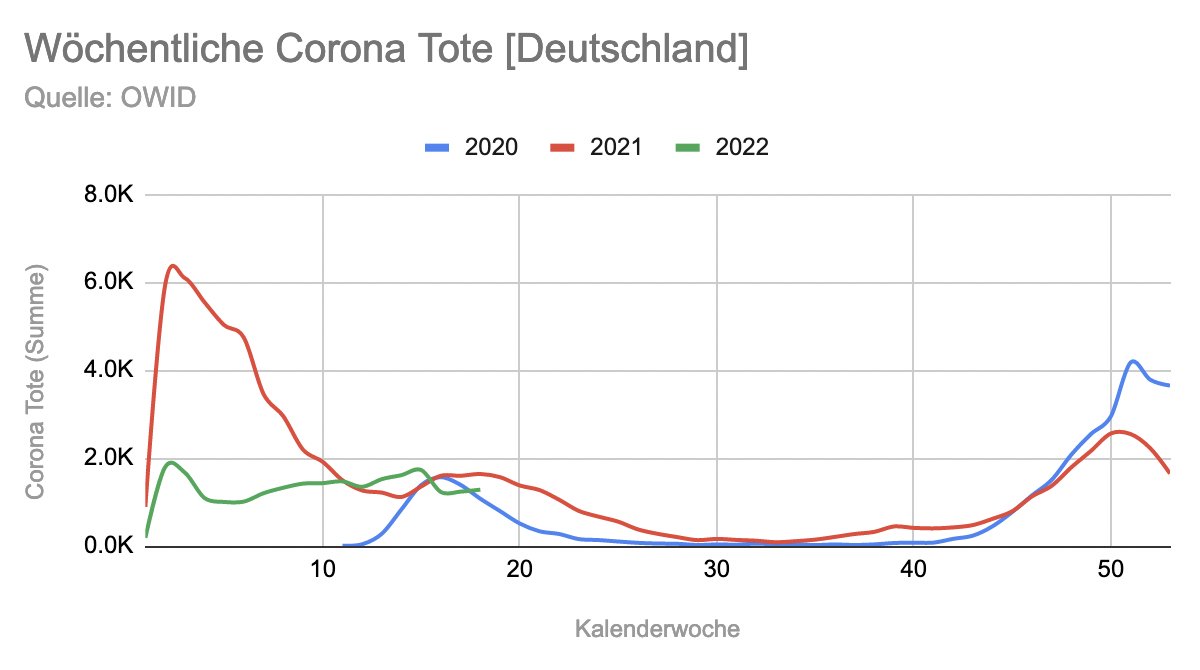
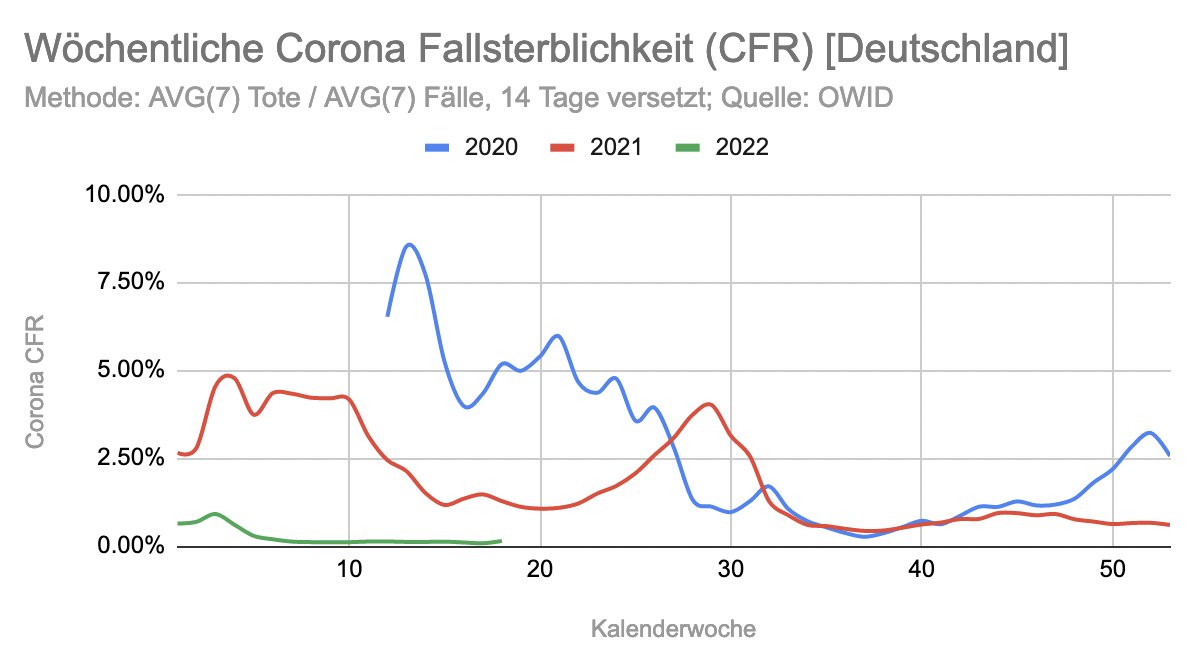
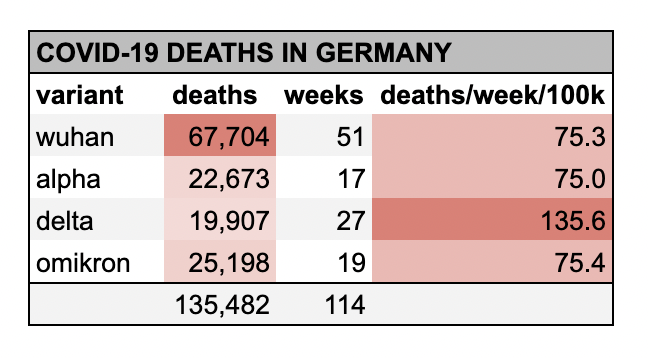
Source: docs.google.com/spreadsheets/d…
Addendum 2: The last weeks, were missing in the above charts...
• • •
Missing some Tweet in this thread? You can try to
force a refresh